

Stocks: Sectors
- Energy
- Materials
- Industrials
- Consumer Discretionary
- Consumer Staples
- Health Care
- Financial
- Technology
- Utilities
Futures
Benchmarks
Forex
Industries
Comparative
Seasonal Start
Economic Data
Symbols by Letter: A | B | C | D | E | F | G | H | I | J | K | L | M | N | O | P | Q | R | S | T | U | V | W | X | Y | Z
Charts Listed Under B

Blue Bird Corp. (NASD:BLBD) Seasonal Chart
For full access, please log in or Subscribe.Seasonal Start: December 29 | B, Consumer Discretionary | Stocks

Vanguard Total International Bond ETF (NASD:BNDX) Seasonal Chart
For full access, please log in or Subscribe.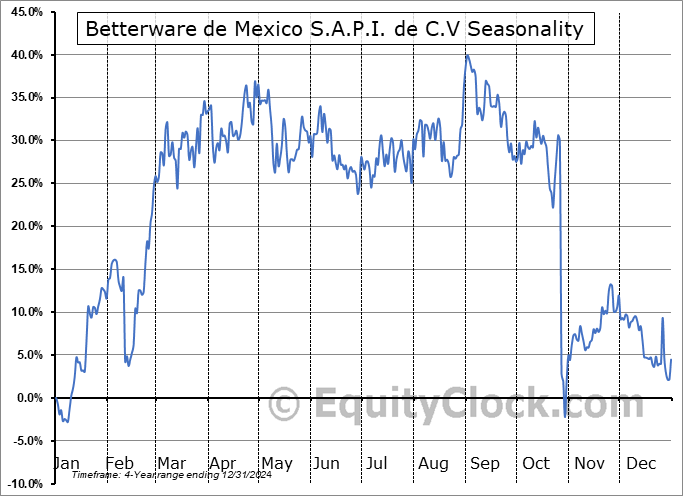
Betterware de Mexico S.A.P.I. de C.V (NYSE:BWMX) Seasonal Chart
For full access, please log in or Subscribe.Seasonal Start: December 29 | B, Consumer Discretionary | Stocks

Biomerica, Inc. (NASD:BMRA) Seasonal Chart
For full access, please log in or Subscribe.Seasonal Start: December 28 | B, Healthcare | Stocks

BIO-key, Intl, Inc. (NASD:BKYI) Seasonal Chart
For full access, please log in or Subscribe.Seasonal Start: December 28 | B, Industrials | Stocks

Butler National (OTCMKT:BUKS) Seasonal Chart
For full access, please log in or Subscribe.Seasonal Start: December 28 | B, Industrials | Stocks

BriaCell Therapeutics Corp. (TSE:BCT.TO) Seasonal Chart
For full access, please log in or Subscribe.Seasonal Start: December 27 | B, Healthcare | Stocks

SPDR Barclays International Treasury Bond ETF (NYSE:BWX) Seasonal Chart
For full access, please log in or Subscribe.
| Sponsored By... |

|