
The period of seasonal strength for the Financial Sector ranges from November 22nd through to April 13th. The seasonality corresponds to the time when banks report fourth and first quarter earnings and provide favourable guidance for the coming year. The seasonal rise in interest rates during the same timeframe is also a benefit to net interest margins.

For full access, please
log in or
Subscribe.
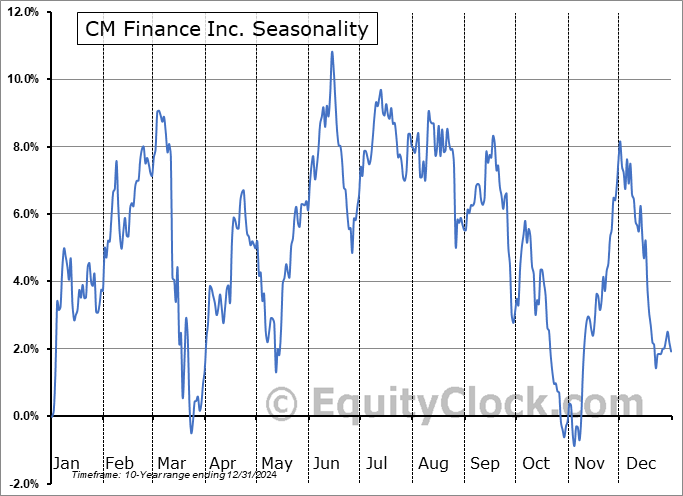
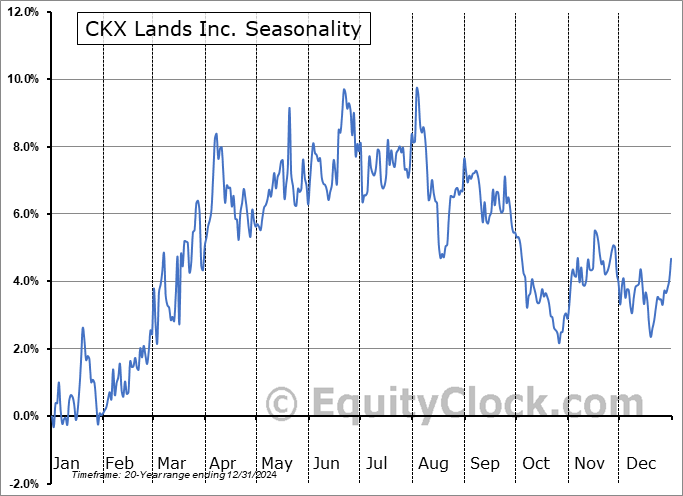
Seasonal Start: December 20 | C, Financial | Stocks
For full access, please
log in or
Subscribe.
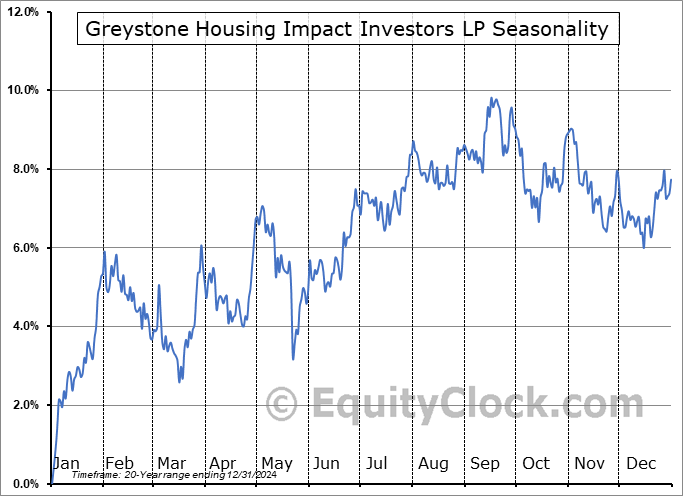
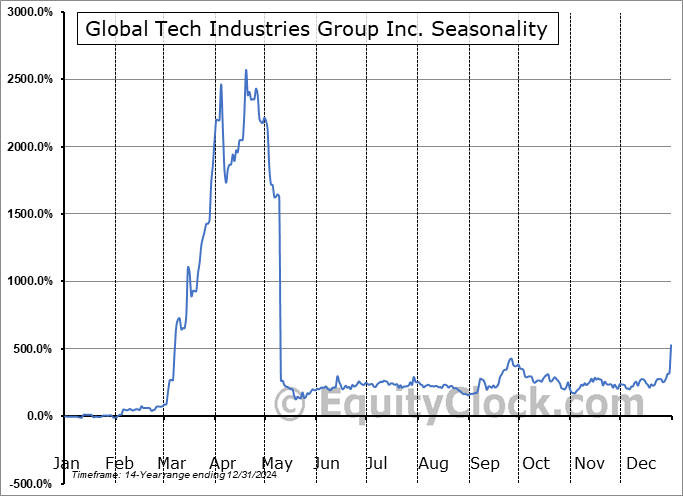
Seasonal Start: December 20 | Financial, G | Stocks
For full access, please
log in or
Subscribe.
Seasonal Start: December 20 | Financial, I | Stocks

For full access, please
log in or
Subscribe.
Seasonal Start: December 20 | Financial, S | Stocks
For full access, please
log in or
Subscribe.
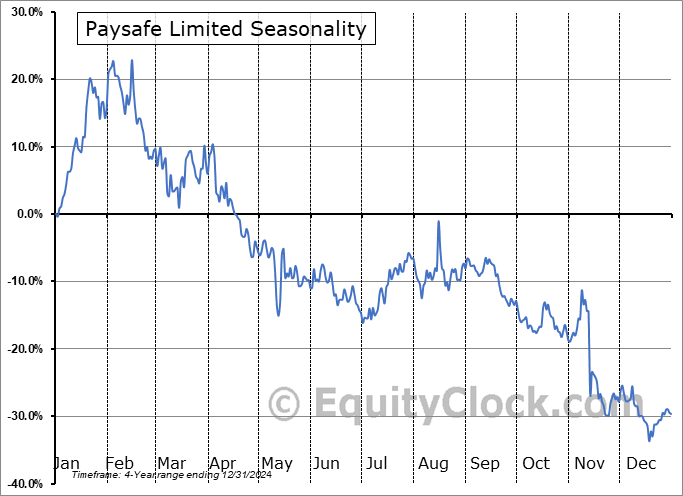
Seasonal Start: December 20 | Financial, P | Stocks

For full access, please
log in or
Subscribe.
Seasonal Start: December 19 | Financial, T | Stocks

For full access, please
log in or
Subscribe.
Seasonal Start: December 19 | B, Financial | Stocks
For full access, please
log in or
Subscribe.
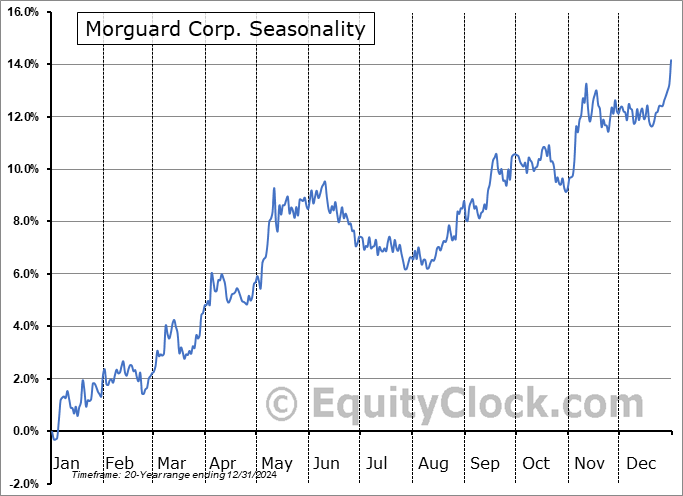
Seasonal Start: December 19 | Financial, M | Stocks
For full access, please
log in or
Subscribe.
Seasonal Start: December 19 | C, Financial | Stocks
For full access, please
log in or
Subscribe.
Seasonal Start: December 19 | Financial, G | Stocks

