You're receiving this daily market outlook because you are subscribed to Equity Clock. Want to opt-out and only receive the monthly and intraday reports? Simply reply to this email to let us know.
Having trouble viewing this email? View in your browser.
Equity Clock - Market Outlook for December 30, 2022
A surge in demand in recent weeks has pushed gasoline product supplied back to the highs of the year, supportive for the price of energy commodities during their period of seasonal strength.
*** Stocks highlighted are for information purposes only and should not be considered as advice to purchase or to sell mentioned securities. As always, the use of technical and fundamental analysis is encouraged in order to fine tune entry and exit points to average seasonal trends.
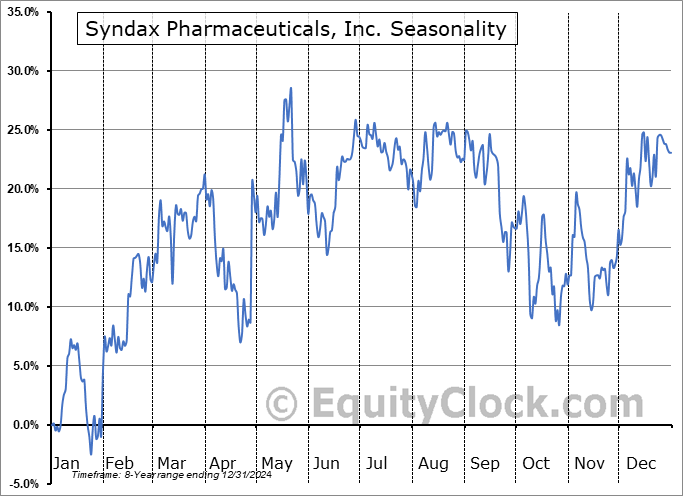
Stocks Entering Period of Seasonal Strength Today:
Subscribers – Click on the relevant link to view the full profile. Not a subscriber? Signup here.
This content is exclusive to subscribers of EquityClock.com. Please Log In or Subscribe to proceed.
The Markets
Stocks rebounded from Wednesday’s selloff as investors attempt to keep the prospect of a successful Santa Claus rally period alive now that end of year tax loss selling/portfolio rebalancing/window dressing has been largely completed with just one session left in the year. The S&P 500 Index closed with a gain of 1.75%, remaining within a consolidation range below the 50-day moving average and horizontal resistance at 3900. While a bear-flag pattern remains apparent on the chart, evidence of waning short-term downside momentum can be picked out as the benchmark holds support at November’s upside open gap between 3770 and 3860. Major moving averages continue to converge on the pivotal 3900, increasing the market’s sensitivity to this hurdle. Another week remains in this so-called Santa Claus rally period and we still cannot count out this favourable end of year gyration from realizing success, despite the discouraging technical path of the benchmark and fundamentals that give little reason for optimism heading into the new year.
This content is exclusive to subscribers of EquityClock.com. Please Log In or Subscribe to proceed.
Seasonal charts of companies reporting earnings today:
No significant earnings scheduled for today.
S&P 500 Index
TSE Composite
If you wish to be excluded from this distribution, simply reply to this email requesting to have your email removed from our list or click on the following link: **Note: You will continue to have access to our reports so long as your subscription at Equity Clock remains active. To manage your subscription to our service, please visit the Members Section at https://charts.equityclock.com/members.