Despite the apparent risk aversion in the market over the past couple of weeks, the trend of the High Beta ETF (SPHB) is still looking encouraging given its now larger exposure to growth (eg. Technology).
*** Stocks highlighted are for information purposes only and should not be considered as advice to purchase or to sell mentioned securities. As always, the use of technical and fundamental analysis is encouraged in order to fine tune entry and exit points to average seasonal trends.
Stocks Entering Period of Seasonal Strength Today:
Subscribers – Click on the relevant link to view the full profile. Not a subscriber? Signup here.


Super Simple Seasonal Portfolio
This content is exclusive to subscribers of EquityClock.com. Please Log In or Subscribe to proceed.
The Markets
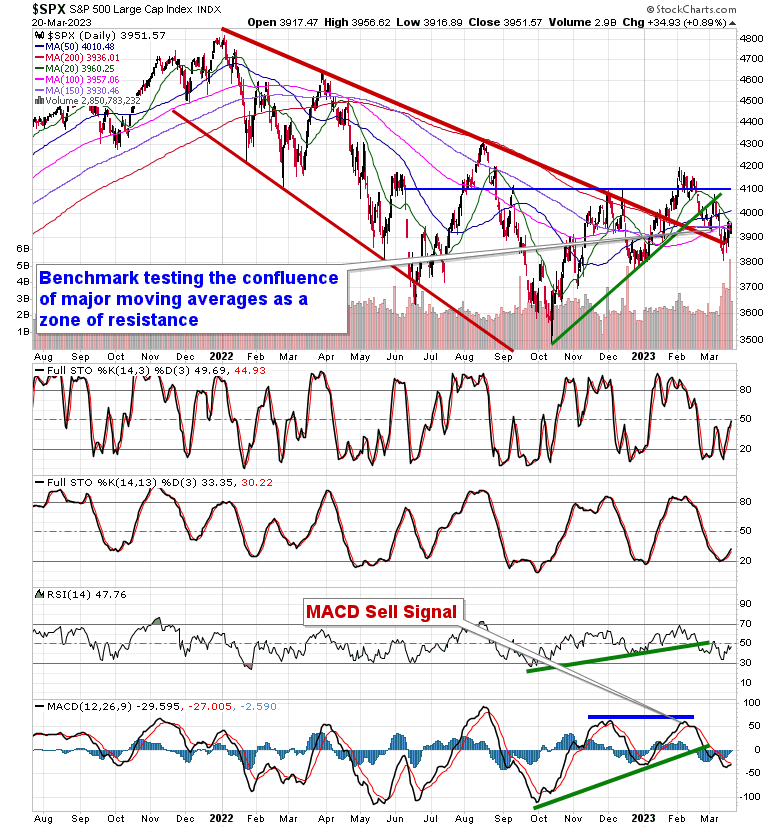
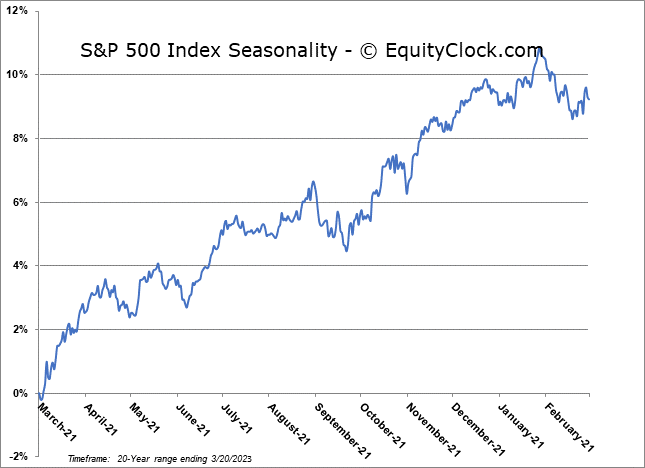
Stocks gained on Monday amidst a rebound in bank stocks as some of the fears surrounding a banking crisis faded following the sale of Credit Suisse to UBS. The S&P 500 Index closed with a gain of just less than nine-tenths of one percent, ending just shy of short-term resistance at the declining 20-day moving average (3960.25). The short-term trend remains that of lower-lows and lower-highs stemming from the peak set at the start of February and momentum indicators have readopted characteristics of a bearish trend below their middle lines. As has been emphasized previously, the December low at 3764 remains a critical hurdle on the downside as violation of this hurdle would return the benchmark to an intermediate path of lower-highs and lower-lows, thereby unleashing the next subset of the market that is willing to sell equity allocations. The confluence of major moving averages in the range of 3900 to 4000 remains a formidable cap. Seasonally, the period between now and the end of April tends to be positive for stocks, but with fundamentals lending themselves to a negative bias of risk assets and the technicals expressing caution of their own, there is little to be excited of this typically upbeat period ahead that runs into the spring.
This content is exclusive to subscribers of EquityClock.com. Please Log In or Subscribe to proceed.
Seasonal charts of companies reporting earnings today:

 Seasonal Chart")


S&P 500 Index

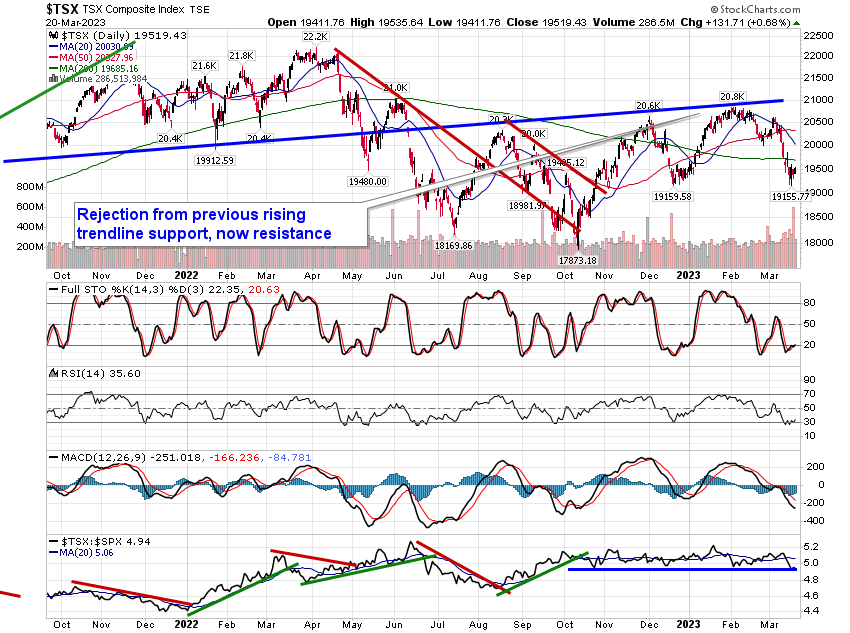
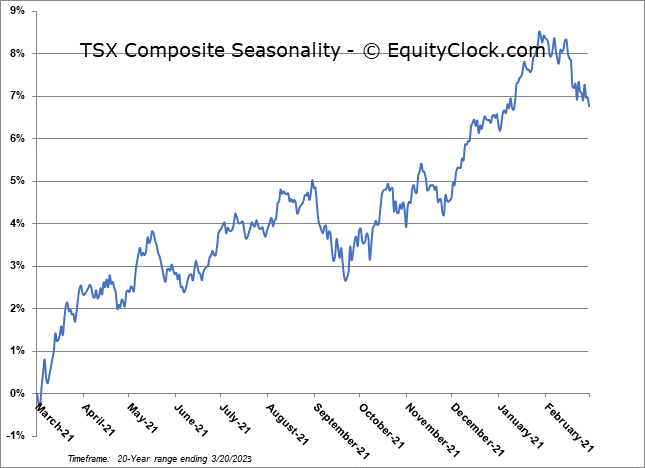
TSE Composite