Looking for setups that are prone to mean-reversion into the end of the quarter.
*** Stocks highlighted are for information purposes only and should not be considered as advice to purchase or to sell mentioned securities. As always, the use of technical and fundamental analysis is encouraged in order to fine tune entry and exit points to average seasonal trends.
Stocks Entering Period of Seasonal Strength Today:
Subscribers – Click on the relevant link to view the full profile. Not a subscriber? Signup here.


Super Simple Seasonal Portfolio
This content is exclusive to subscribers of EquityClock.com. Please Log In or Subscribe to proceed.
The Markets
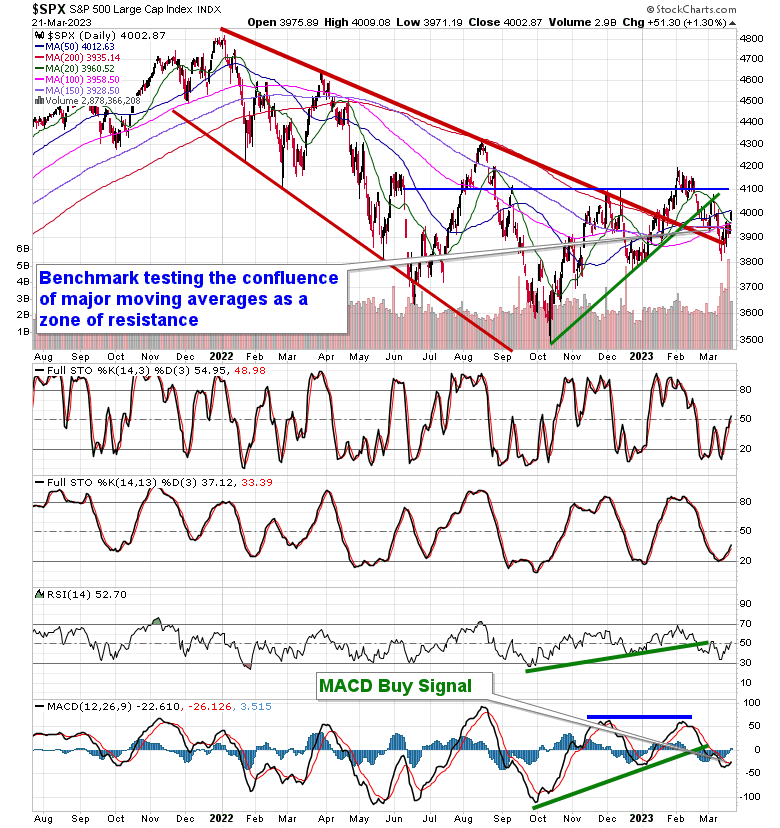
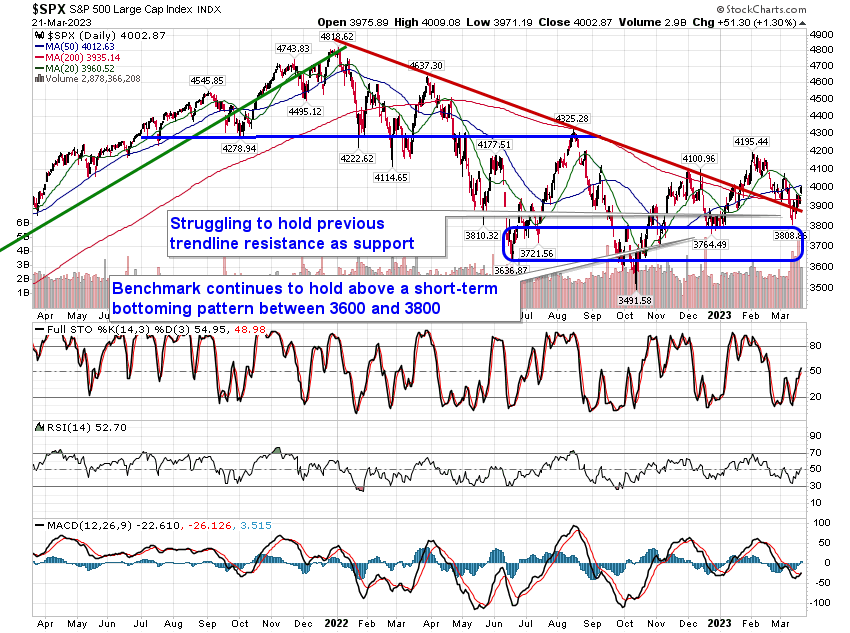
Stocks rebounded on Tuesday as sectors that had beaten down over the past week reverted back to the mean ahead of the important FOMC event on Wednesday. The S&P 500 Index closed higher by 1.30%, moving back above both 20 and 200-day moving averages and ending just below the 50-day moving average at 4012. Overall, the benchmark remains burdened by this confluence of major moving averages in the range between 3900 to 4000 that is acting as a position of resistance; it appears likely that a catalyst would be required to break the benchmark up and out. MACD has triggered a new Buy signal following the crossover of its signal line, but the bullish event comes at a level that is lower than the bullish crossover that preceded it at the start of January, highlighting a divergence versus price. The momentum indicator is showing a path of lower-lows and lower-highs, albeit slight, since the peak charted in December, hinting of a similar outcome for price ahead.
This content is exclusive to subscribers of EquityClock.com. Please Log In or Subscribe to proceed.
Seasonal charts of companies reporting earnings today:


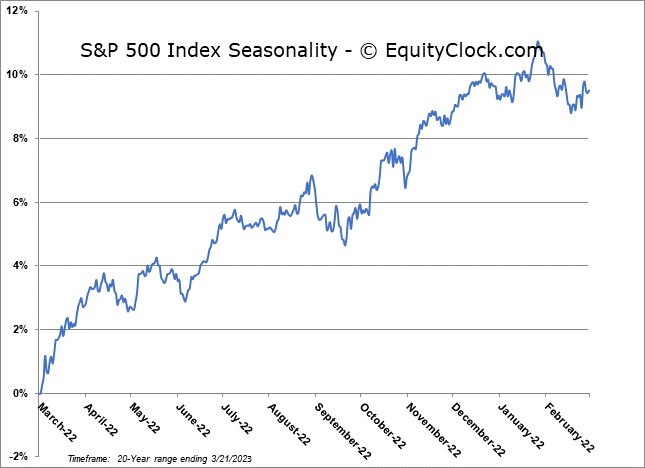
S&P 500 Index
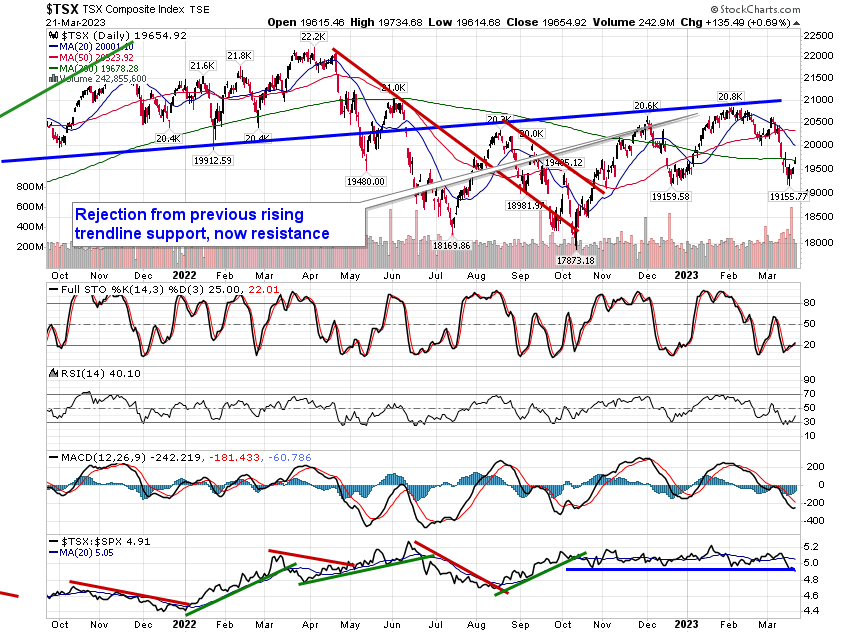
TSE Composite