Treasury yield spreads are showing signs of bottoming and this is not a good thing.
*** Stocks highlighted are for information purposes only and should not be considered as advice to purchase or to sell mentioned securities. As always, the use of technical and fundamental analysis is encouraged in order to fine tune entry and exit points to average seasonal trends.
Stocks Entering Period of Seasonal Strength Today:
Subscribers – Click on the relevant link to view the full profile. Not a subscriber? Signup here.


Super Simple Seasonal Portfolio
This content is exclusive to subscribers of EquityClock.com. Please Log In or Subscribe to proceed.
The Markets
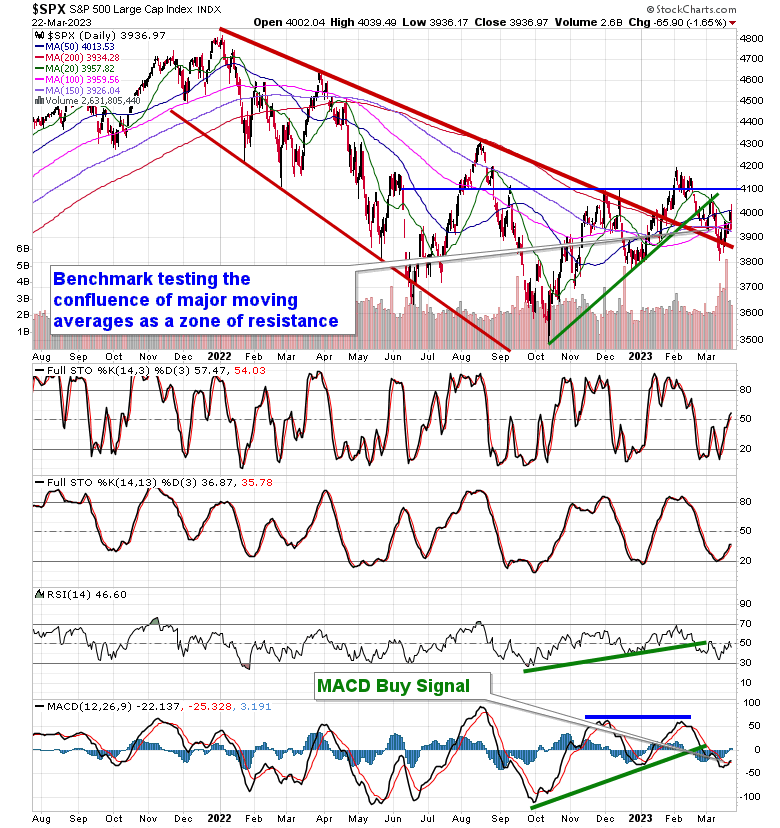
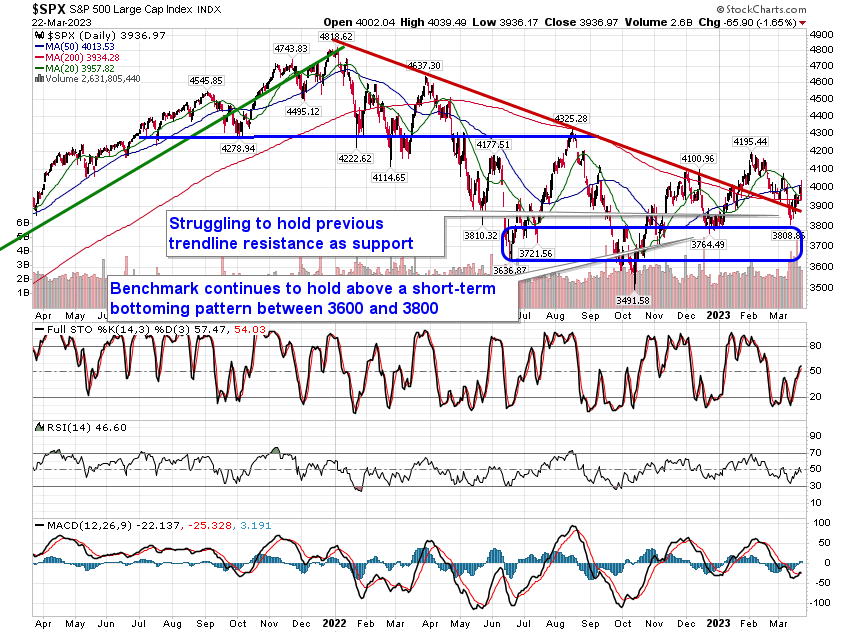
Stocks and bond yields dropped on Wednesday as the market reacted to the latest FOMC meeting announcement. The S&P 500 Index closed down by 1.65%, showing a sharp negative reaction around now intermediate resistance at the 50-day moving average. The confluence of major moving averages, including the 20, 50, and 200-day, in the range between 3900 and 4000 remains a formidable barrier preventing the equity benchmark from achieving the strength that is typical of this period heading into the start of spring; until the hurdle is broken, it has to be expected that it will cap the near-term trajectory until the uncertainty in the market alleviates. The December low at 3764 remains a critical level to watch as a violation of this hurdle would start to imply negative intermediate implications beyond the short-term burden that has been experienced since the start of February. In a recessionary economic framework, a break below the December low and the rising 200-week moving average at 3736 would be the base case and it is certainly not the environment that we want to have a positive correlation to risk assets within investment portfolios.
This content is exclusive to subscribers of EquityClock.com. Please Log In or Subscribe to proceed.
Seasonal charts of companies reporting earnings today:


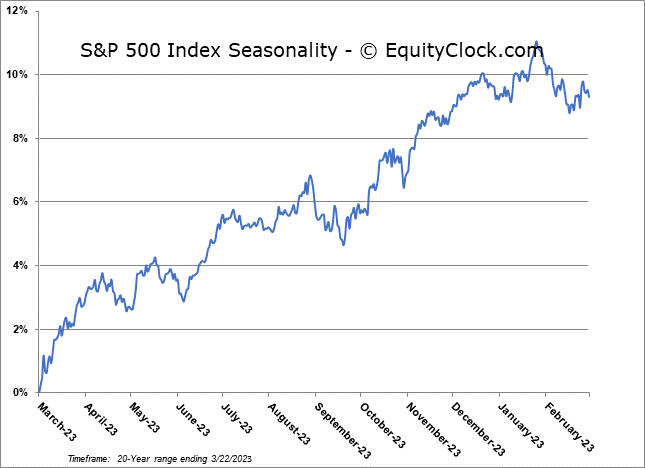
S&P 500 Index
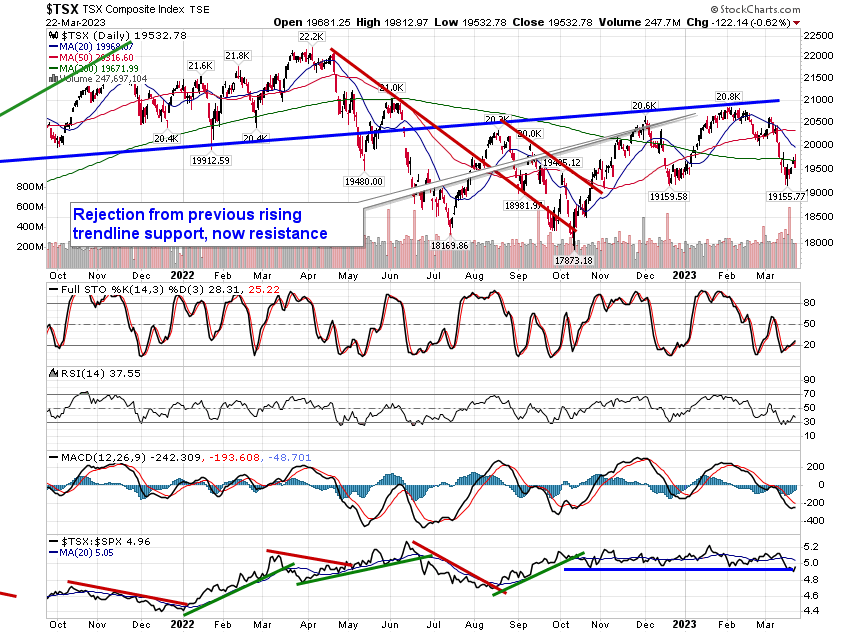
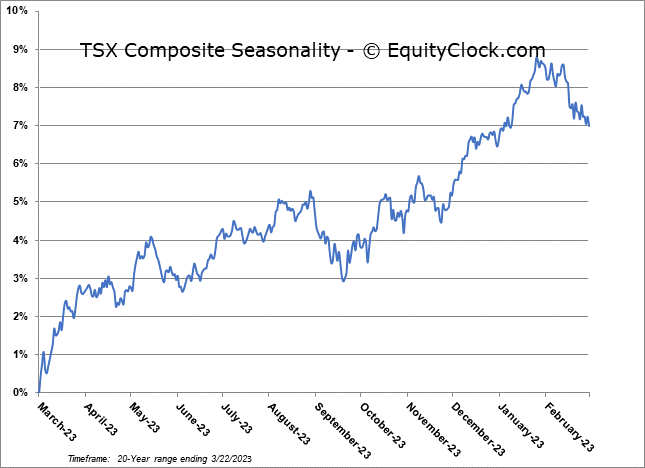
TSE Composite