Coincident indicators continue to hint that an economic recession is underway.
*** Stocks highlighted are for information purposes only and should not be considered as advice to purchase or to sell mentioned securities. As always, the use of technical and fundamental analysis is encouraged in order to fine tune entry and exit points to average seasonal trends.
Stocks Entering Period of Seasonal Strength Today:
Subscribers – Click on the relevant link to view the full profile. Not a subscriber? Signup here.


Super Simple Seasonal Portfolio
This content is exclusive to subscribers of EquityClock.com. Please Log In or Subscribe to proceed.
The Markets
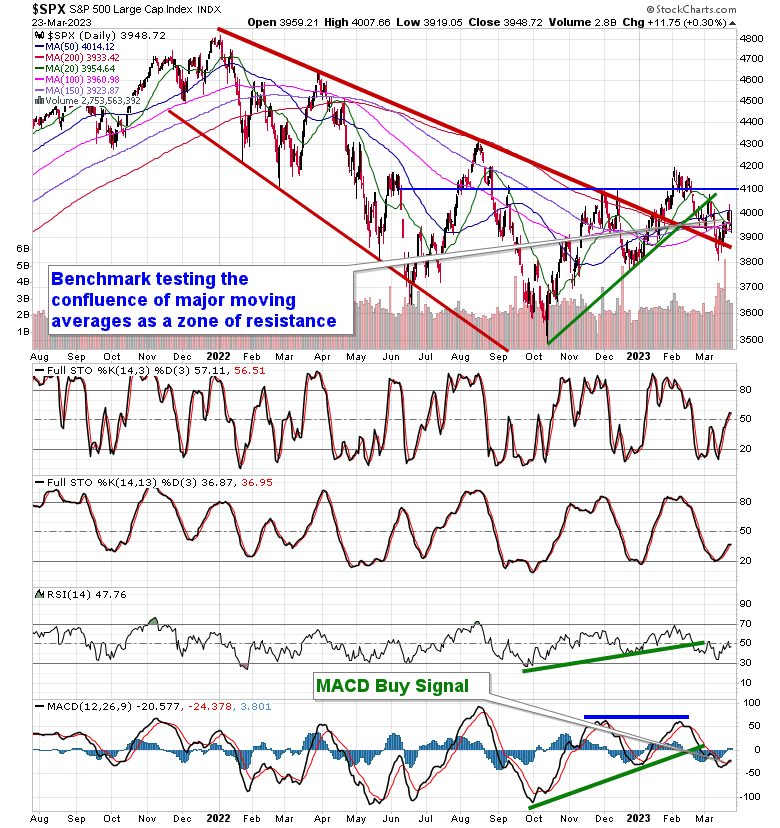
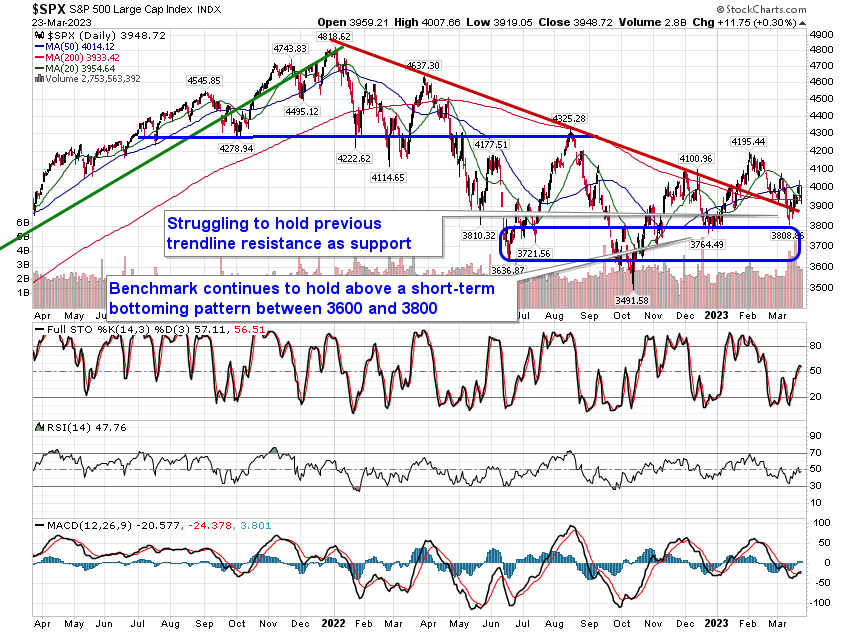
Stocks fluctuated in an extreme manner on Thursday as investors digested the headline risks in the market that remain ongoing. The S&P 500 Index closed with a gain of three-tenths of one percent, charting an indecisive doji candlestick in the midst of this confluence of resistance at major moving average in the range of 3900 to 4000. The benchmark traded to as high as the 50-day moving average (4014) at the height of the session and sellers showed up en masse, briefly driving the benchmark into negative territory after gaining almost two percent in the early morning trade. The reversal also comes at the upper limit of short-term declining trendline resistance that has capped the benchmark since the high set at the start of February, emphasizing the short-term path of lower-lows and lower-highs that the benchmark remains. The December low at 3764 is the important level to watch as it pertains to the intermediate-term path as a violation of this hurdle would conclude what is still viewed as a trend of higher-highs and higher-lows stemming from the October low. The shift of the intermediate path from positive to negative would place the October lows at risk, particularly should various coincident indications of economic activity continue to evolve unfavourably, signalling the onset of a recession.
This content is exclusive to subscribers of EquityClock.com. Please Log In or Subscribe to proceed.
Seasonal charts of companies reporting earnings today:


S&P 500 Index
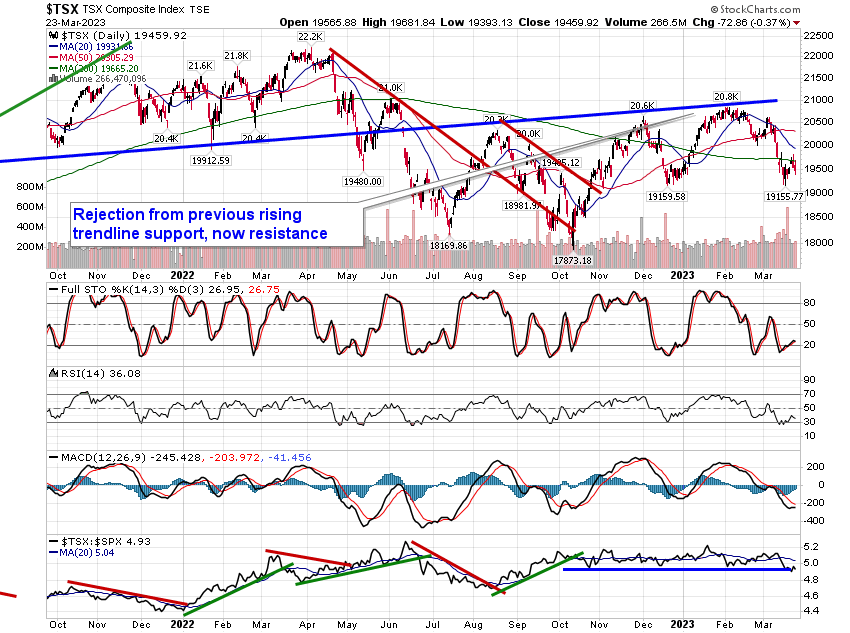
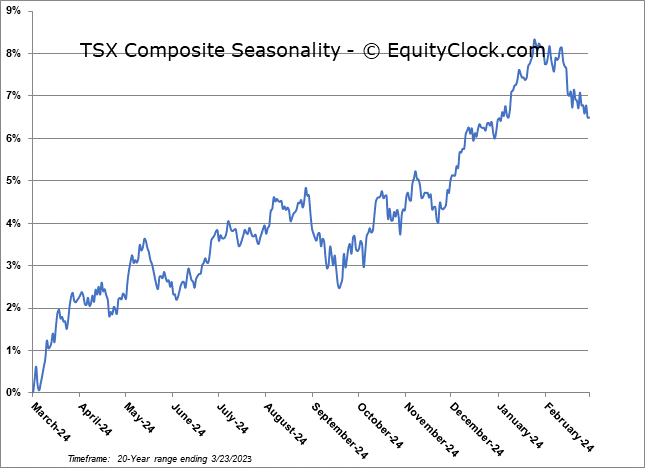
TSE Composite