Market ends the week on a defensive note as caution pertaining to the economy grows.
*** Stocks highlighted are for information purposes only and should not be considered as advice to purchase or to sell mentioned securities. As always, the use of technical and fundamental analysis is encouraged in order to fine tune entry and exit points to average seasonal trends.
Stocks Entering Period of Seasonal Strength Today:
Subscribers – Click on the relevant link to view the full profile. Not a subscriber? Signup here.


Super Simple Seasonal Portfolio
This content is exclusive to subscribers of EquityClock.com. Please Log In or Subscribe to proceed.
The Markets
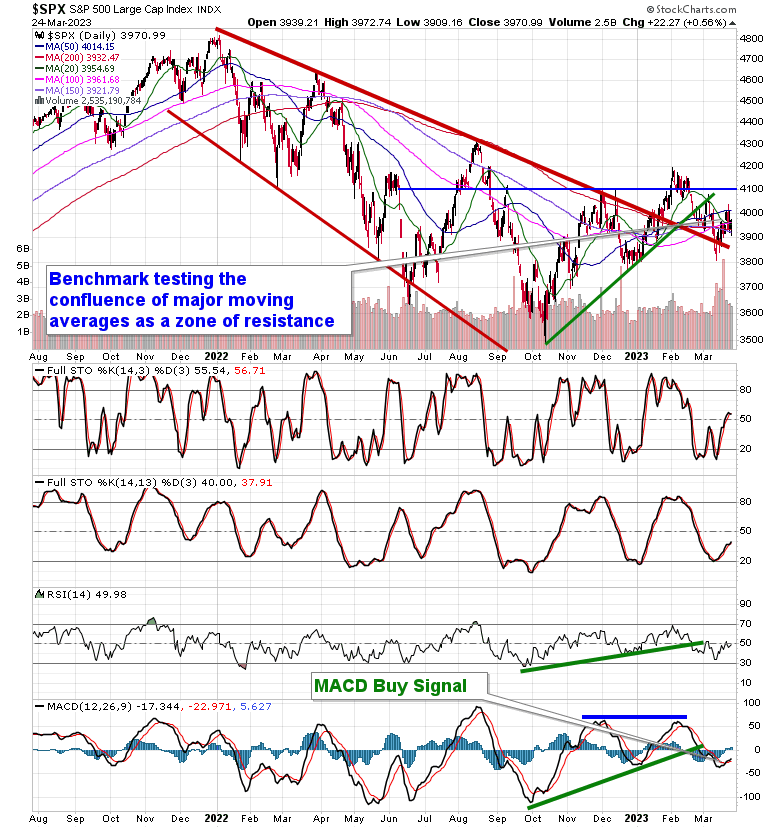
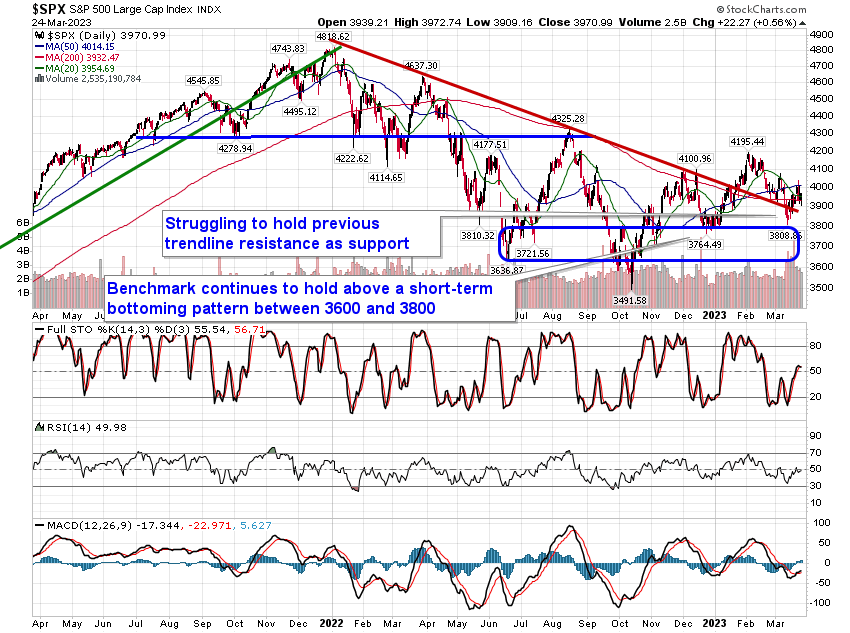
Markets ended the week on a notably defensive tone as staples, utilities, health care and REITs topped the tape. The S&P 500 Index closed with a gain of just over half of percent, managing to maintain levels above the 200-day moving average for another day. Resistance has been suggested by the 50-day moving average based on the rejection from this hurdle mid-week. This upper limit to this confluence of major moving averages in the range between 3900 to 4000 remains a formidable barrier capping the benchmark as we progress toward what is typically another strong month for stocks in April. MACD remains on a buy signal following a bullish crossover recorded in the past week, but it continues to sit below its middle line, which is characteristic of a bearish trend. As we have been highlighting, it would still take a break below the December low for the benchmark at 3764 to suggest negative intermediate implications for the benchmark given that the trend of higher-highs and higher-lows from the October bottom would be violated. While a number of cyclical sectors have seen an undercut of the December bottom (eg. energy, financials, materials, industrials), it is the formerly maligned technology sector, the largest segment of the market, that is mitigating a breakdown in broad market benchmarks, such as the S&P 500 Index. Fear/panic and a corresponding waterfall decline in equity prices will typically only occur when investors have nowhere to turn and, while they have been abandoned core-cyclical sectors in the midst of heightened recession risks, they have found other opportunities to rotate towards.
This content is exclusive to subscribers of EquityClock.com. Please Log In or Subscribe to proceed.
Seasonal charts of companies reporting earnings today:


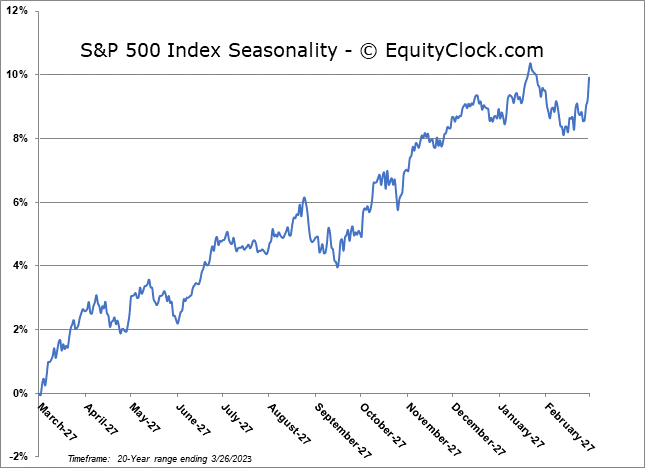
S&P 500 Index
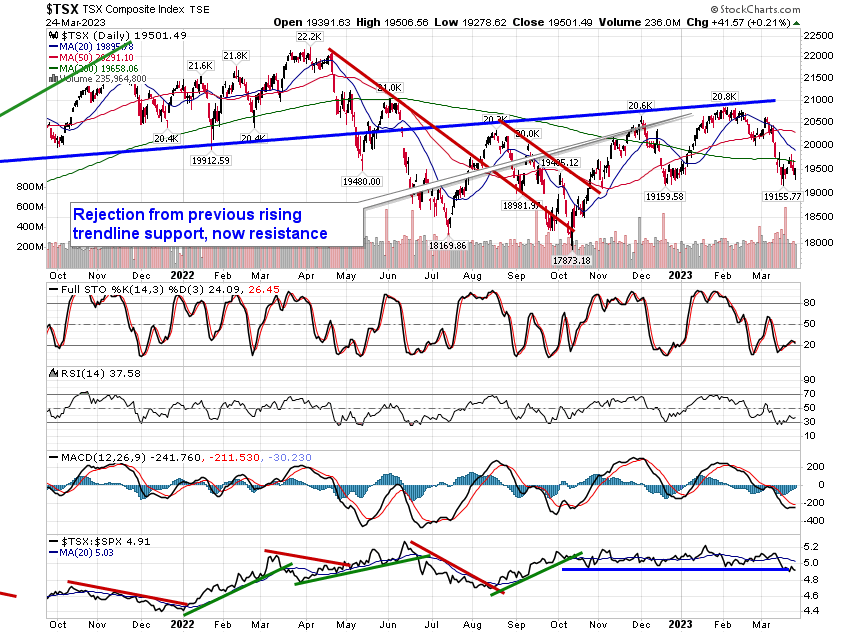
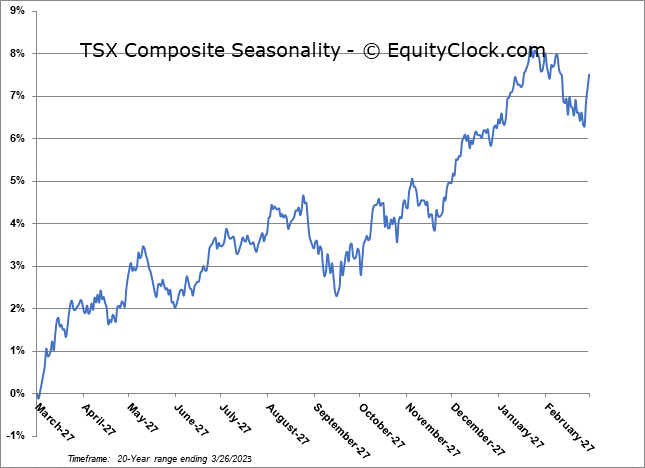
TSE Composite