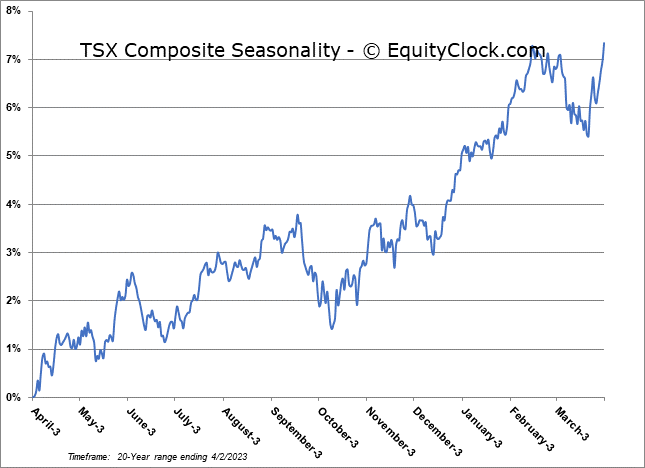
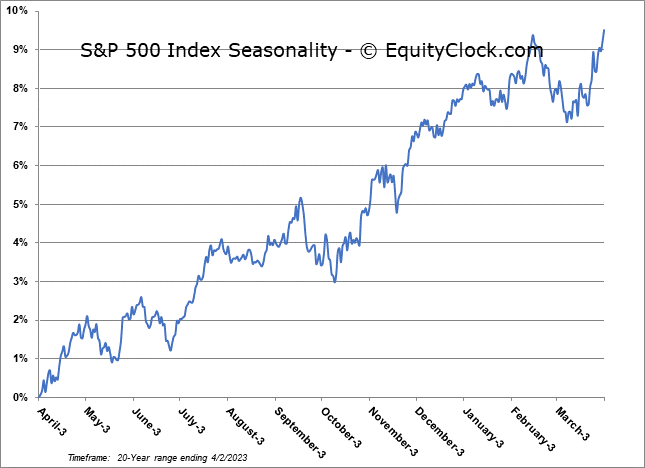
April has historically been the strongest month of the year for stocks with the S&P 500 Index gaining an average of 2.3%.
*** Stocks highlighted are for information purposes only and should not be considered as advice to purchase or to sell mentioned securities. As always, the use of technical and fundamental analysis is encouraged in order to fine tune entry and exit points to average seasonal trends.
Stocks Entering Period of Seasonal Strength Today:
Subscribers – Click on the relevant link to view the full profile. Not a subscriber? Signup here.


Super Simple Seasonal Portfolio
This content is exclusive to subscribers of EquityClock.com. Please Log In or Subscribe to proceed.
Note to subscribers using Yahoo email (Yahoo.com, AOL, Verizon, Rogers, RocketMail): On April 1st, our daily report bounced back from all those that use Yahoo mail servers for reasons that are not immediately clear (perhaps just a poor April Fool’s joke). We will be working to address the issue in the days ahead.
We apologize for any inconvenience that may result. If you ever wish to change the email address that you use to receive our reports, you can do so in the Members section of the Chart Database (https://charts.equityclock.com/members).
The Markets
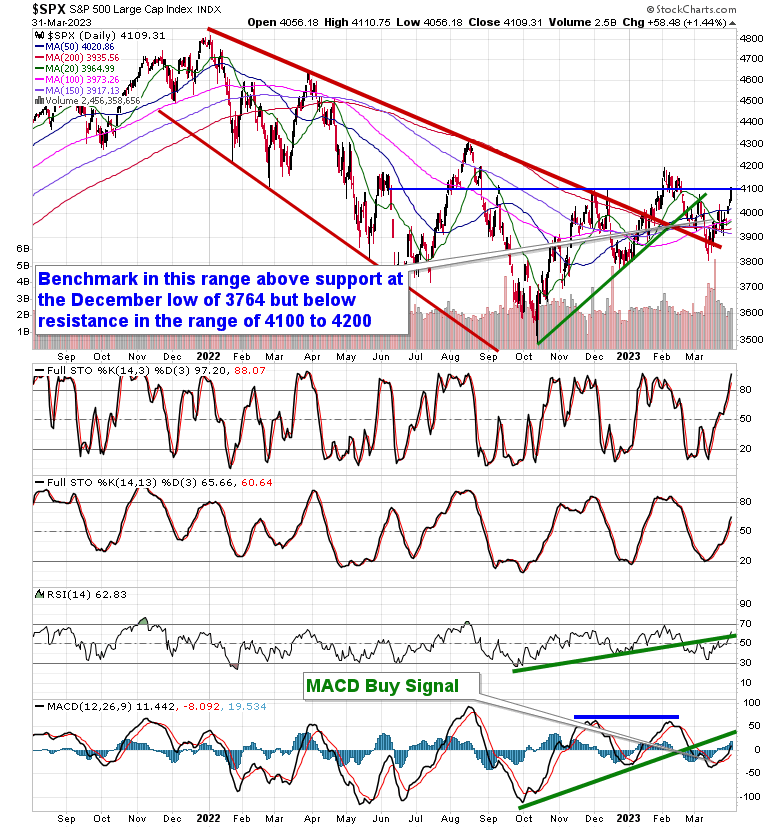
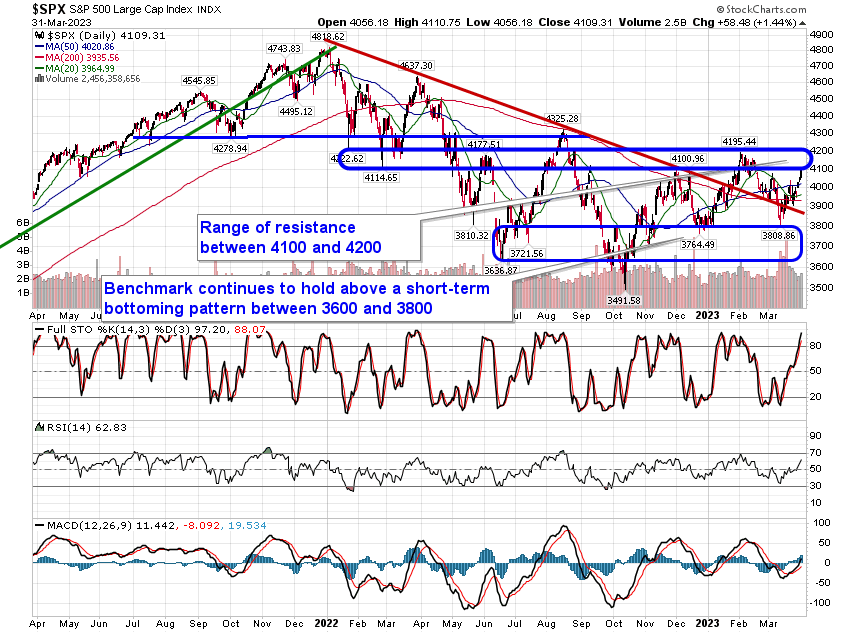
Stocks rallied to close out the final session of the quarter as investors brush of concerns from the past month pertaining to the banking turmoil and economic degradation and continue to turn to those segments that have been in a position to benefit from the peak in the cost of borrowing. The S&P 500 Index closed with a gain of 1.44%, ending at the high of the month and violating the previously highlighted short-term path of lower-lows and lower-highs stemming from the February peak. The benchmark has moved beyond the confluence of major moving averages in the range of 3900 to 4000 and now finds itself into the horizontal range of resistance between 4100 and 4200 that has capped upside potential for months. Still, despite this barrier overhead, the benchmark remains in this intermediate rising trend of higher-highs and higher-lows stemming from the October lows given that price has managed to hold levels above the December lows. As has been highlighted, this has been sufficient keep the potential of strength that is normal for March and April alive, despite a fundamental backdrop that has been trying to convince us of an alternate direction. Our Accumulate candidates in our weekly chartbooks continue to appropriately target the strength in the market that has been realized through the past month, primarily in the technology sector, but the performance of the past week may require another look at those that are on our list to Avoid given signs of support below some of the segments that have been/are in downtrends are now showing signs of support (eg. Utilities and REITs). Stay tuned to our chart books update on Monday for the highlights.
This content is exclusive to subscribers of EquityClock.com. Please Log In or Subscribe to proceed.
Seasonal charts of companies reporting earnings today:


S&P 500 Index
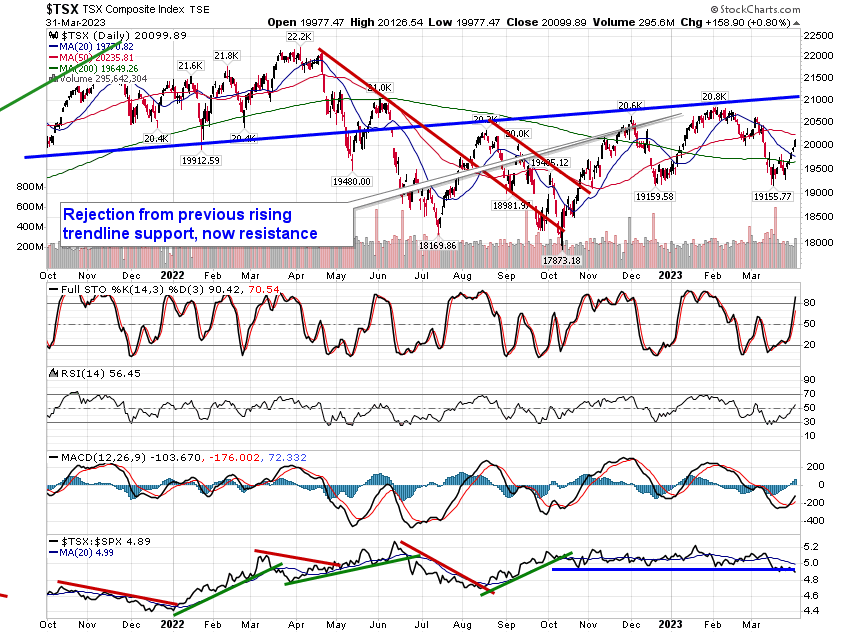
TSE Composite