If the market is so bullish (risk-on), then why are short-term treasury bond prices still around 52-week highs?
*** Stocks highlighted are for information purposes only and should not be considered as advice to purchase or to sell mentioned securities. As always, the use of technical and fundamental analysis is encouraged in order to fine tune entry and exit points to average seasonal trends.
Stocks Entering Period of Seasonal Strength Today:
Subscribers – Click on the relevant link to view the full profile. Not a subscriber? Signup here.


Super Simple Seasonal Portfolio
This content is exclusive to subscribers of EquityClock.com. Please Log In or Subscribe to proceed.
The Markets
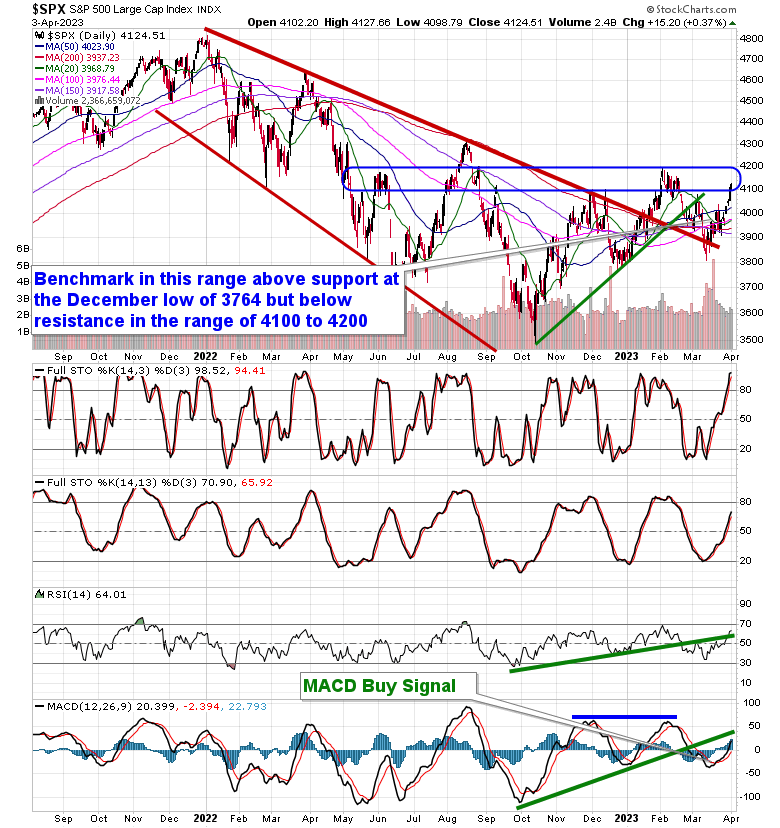
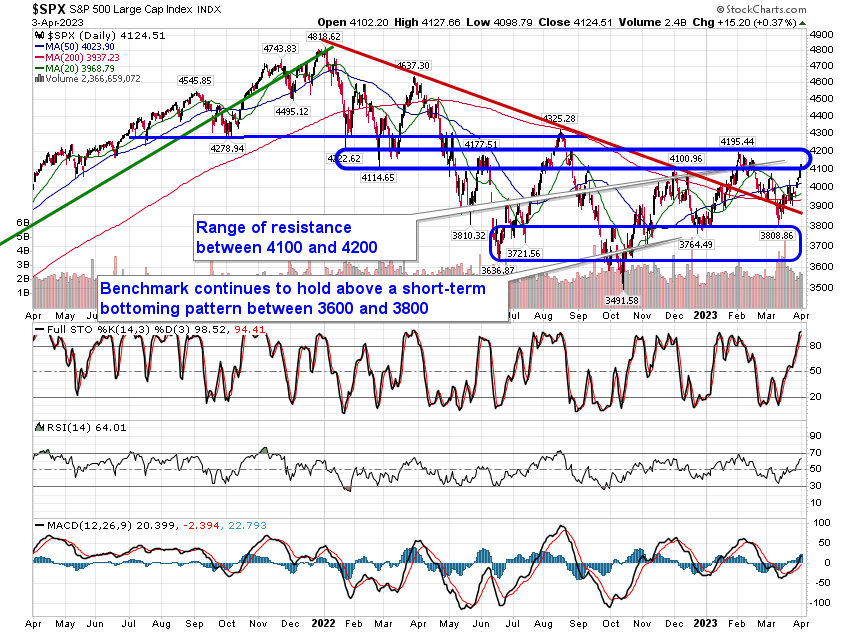
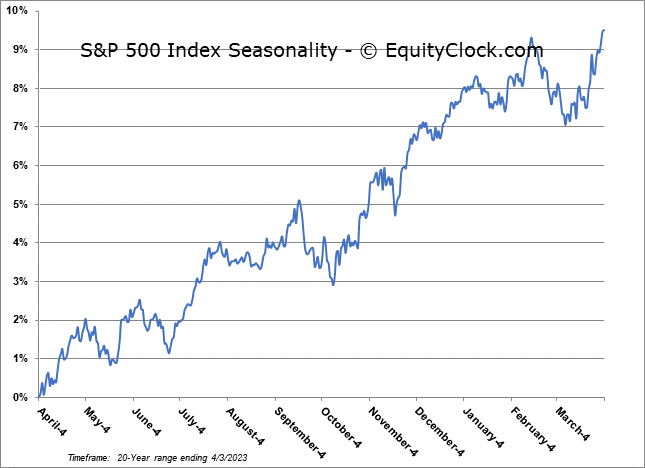
Stocks gained in the first session of the new month and quarter as investors raced back into energy stocks following a shock cut in oil production from OPEC+. The S&P 500 Index closed higher by just less than four-tenths of one percent, continuing to make further progress above the confluence of major moving averages between 3900 and 4000. The benchmark presently finds itself within a range of resistance between 4100 to 4200, a span that has capped the upside trajectory of the benchmark through much of the past ten months. Momentum indicators continue to point higher and MACD remains on a buy signal that was triggered on March 21st. As we progress through the month of April, representing the last month in the best six month seasonal trend for stocks, our focus is on those groups rated as Accumulate candidates within our weekly chart books as we seek to continue to be exposed to those areas of the market that are exhibiting strength while setting ourselves up for what could be a highly uncertain off-season for the equity market that begins in May.
This content is exclusive to subscribers of EquityClock.com. Please Log In or Subscribe to proceed.
Seasonal charts of companies reporting earnings today:


S&P 500 Index
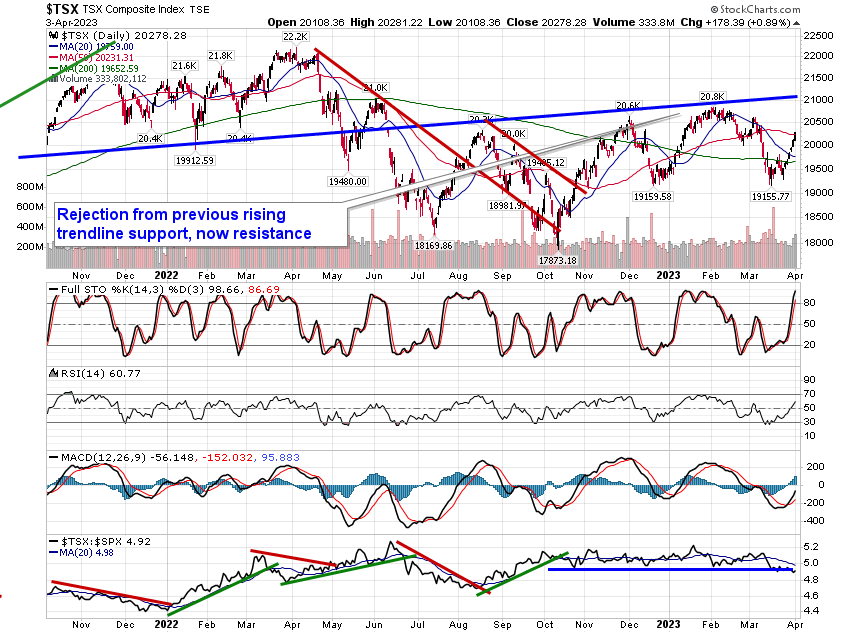
TSE Composite