The rotation that is playing out in the market is keeping the large-cap benchmark supported, but, in a recession scenario, a break below the long-term rising range would be expected.
*** Stocks highlighted are for information purposes only and should not be considered as advice to purchase or to sell mentioned securities. As always, the use of technical and fundamental analysis is encouraged in order to fine tune entry and exit points to average seasonal trends.
Stocks Entering Period of Seasonal Strength Today:
Subscribers – Click on the relevant link to view the full profile. Not a subscriber? Signup here.


Super Simple Seasonal Portfolio
This content is exclusive to subscribers of EquityClock.com. Please Log In or Subscribe to proceed.
Note: Due to the Good Friday holiday closure of markets in the US and Canada, our next report will be released on Monday.
The Markets
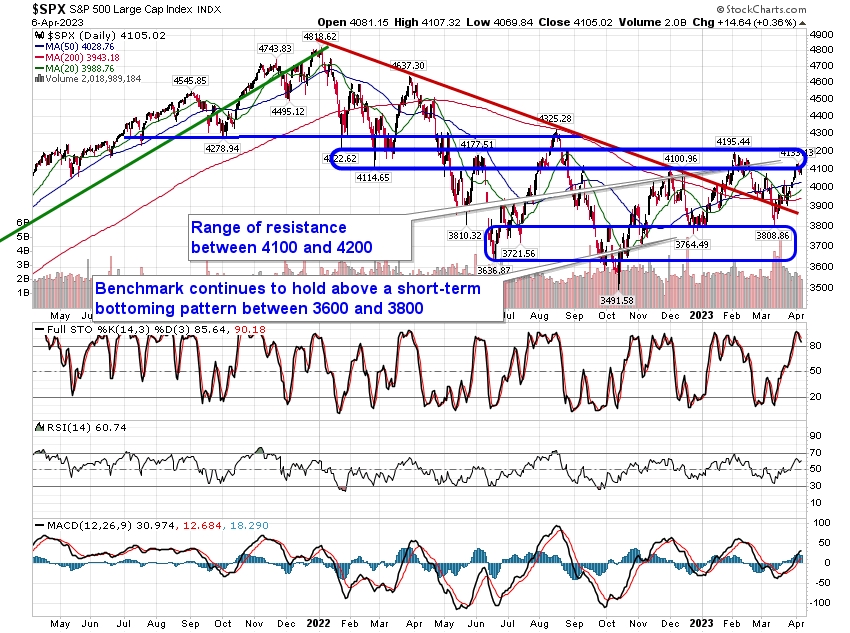
Stocks edged higher to close out the holiday shortened trading week as investors await the always anticipated monthly payroll report that is slated to be released on Friday. The S&P 500 Index closed higher by just over a third of one percent, reaching back into the range of overhead resistance between 4100 and 4200. While MACD remains on a buy signal and the momentum indicator remains sloped higher, the histogram of the indicator is beginning to contract as the technical indicator converges on its signal line in what could become a bearish crossover in the days/weeks ahead. If MACD charts a bearish cross below the level of the last MACD sell signal triggered early in February, it would continue to emphasize the lack of upside momentum in the market, hinting that the path of lower-lows and lower-highs since MACD peaked at the start of December will be revealed with respect to price, as well. Near-term support can continue to be pegged in the span of the confluence of major moving averages between 3900 and 4000 and, in a point of optimism, the variable hurdles are starting to show slight signs of curling higher. The benchmark is still a ways off from seeing these averages trend in a highly correlated manner, either higher or lower, revealing the steady parallel pattern that is characteristic of a trending market. There remains segments of this market that are worthy to Accumulate and those that should be Avoided and we break them all out in our weekly chart books.

This content is exclusive to subscribers of EquityClock.com. Please Log In or Subscribe to proceed.
Seasonal charts of companies reporting earnings today:


S&P 500 Index
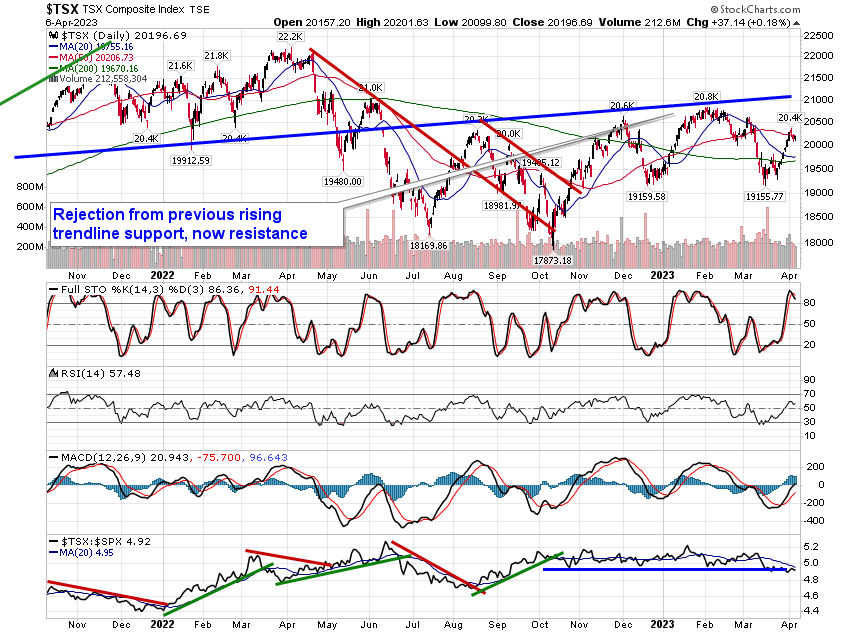
TSE Composite