The trend retail sales has yet to show a path that is representative of the looming onset of an economic recession.
*** Stocks highlighted are for information purposes only and should not be considered as advice to purchase or to sell mentioned securities. As always, the use of technical and fundamental analysis is encouraged in order to fine tune entry and exit points to average seasonal trends.
Stocks Entering Period of Seasonal Strength Today:
Subscribers – Click on the relevant link to view the full profile. Not a subscriber? Signup here.


Super Simple Seasonal Portfolio
This content is exclusive to subscribers of EquityClock.com. Please Log In or Subscribe to proceed.
The Markets
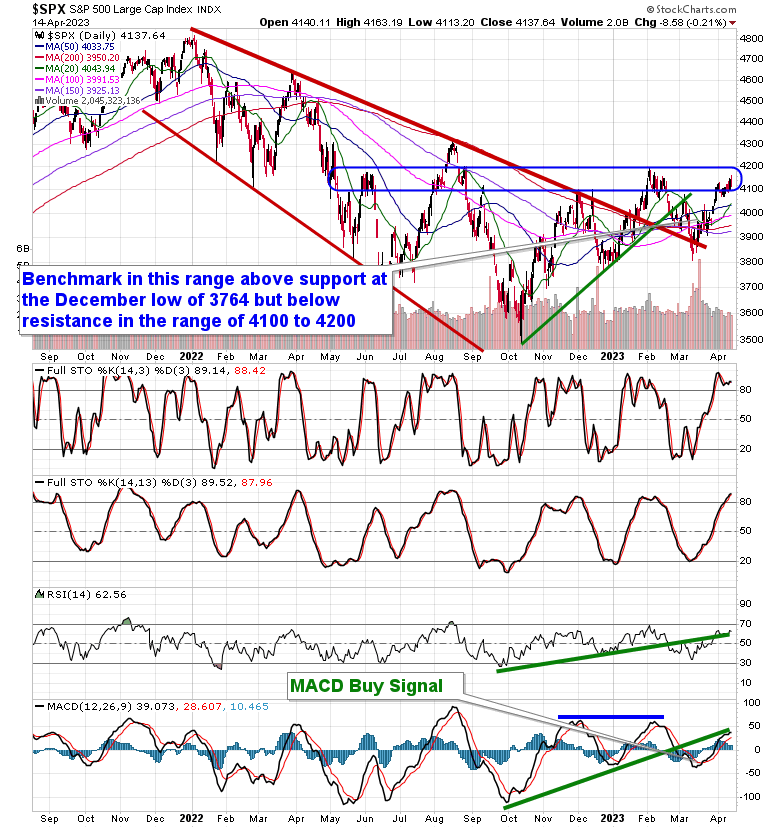
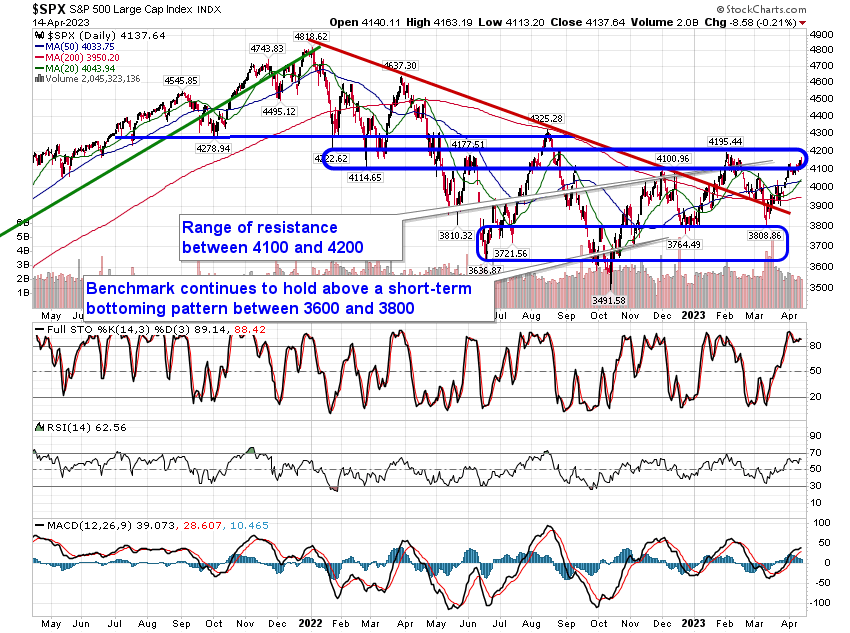
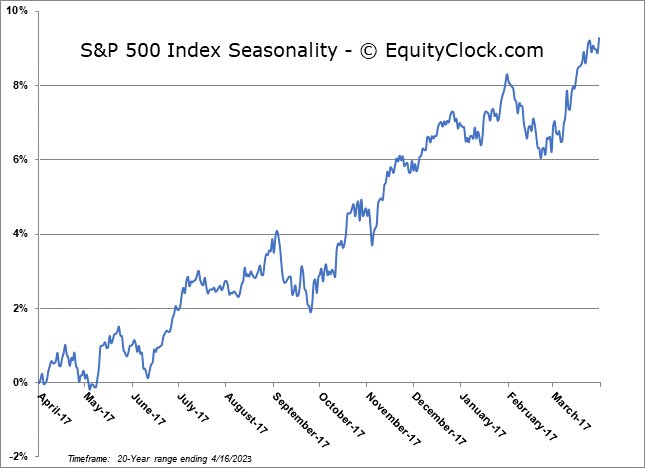
Stocks closed mildly lower on Friday as the market struggles to attract buying demand in order to fuel an upside breakout. The S&P 500 Index closed down by just over two-tenths of one percent, charting a rather indecisive doji candlestick below the range of resistance between 4100 and 4200. Momentum indicators continue to waiver with the MACD histogram increasing retracing back to 0 as the technical indicator converges on its signal line following the buy signal that was triggered on March 21st. Major moving averages, now in the range of 3950 to 4050, remain in positions of support, but the more important hurdle on the downside remains the December low at 3764 as a definitive break of this barrier would bring an end to the intermediate path of higher-highs and higher-lows stemming from the October bottom. The negative divergence being observed with respect to various momentum indicators continues highlight a market that is not all that excited to be aggressive on the long side of stocks with the fundamental uncertainties that persist. Stocks remain in this period of strength that reaches a peak around the start of May, effectively capping the best six months of the year for stocks that started in October, and our concerns remain elevated over what may become of the path for the market as we progress further into the spring.
This content is exclusive to subscribers of EquityClock.com. Please Log In or Subscribe to proceed.
Seasonal charts of companies reporting earnings today:


S&P 500 Index
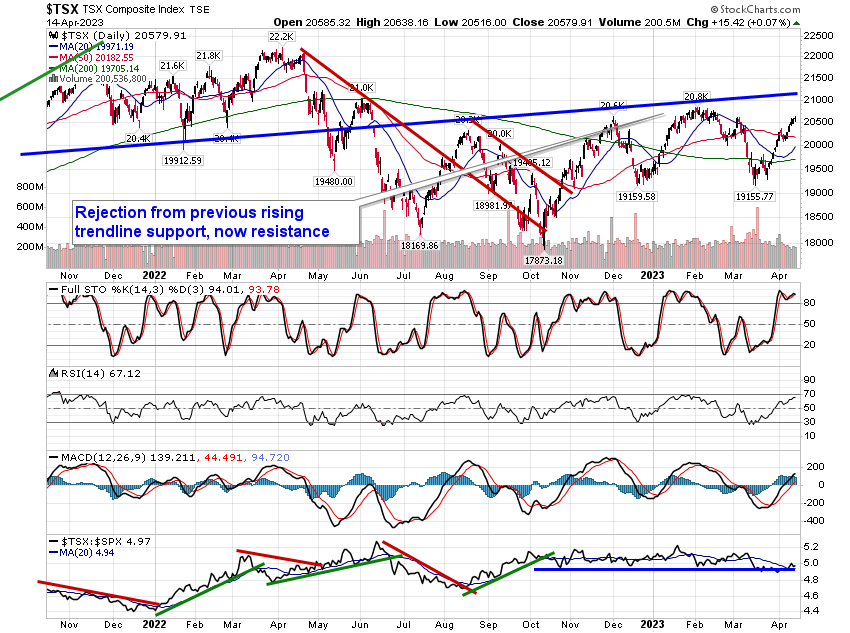
TSE Composite