You're receiving this daily market outlook because you are subscribed to Equity Clock. Want to opt-out and only receive the monthly and intraday reports? Simply reply to this email to let us know.
Having trouble viewing this email? View in your browser.
Equity Clock - Market Outlook for April 26, 2023
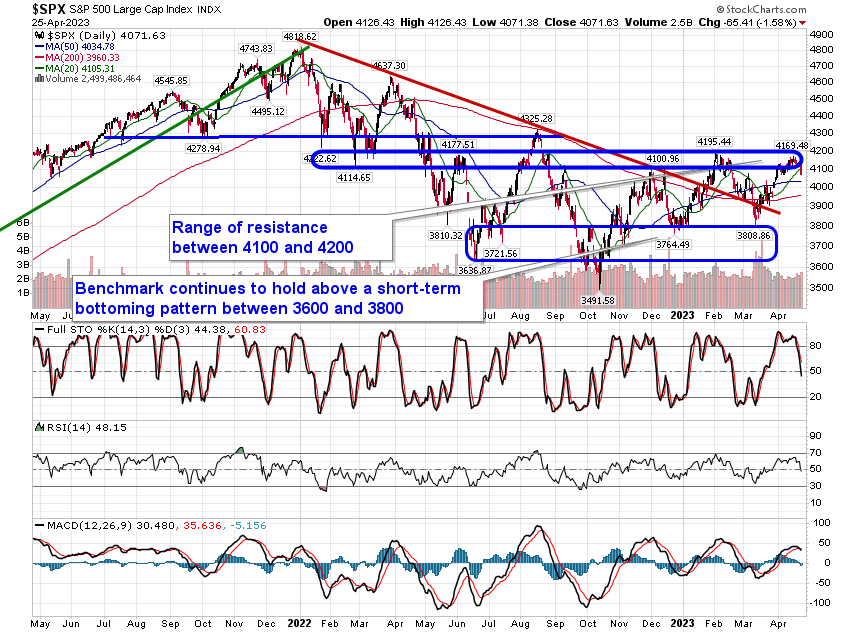
The move below the rising wedge pattern on the chart of the S&P 500 Index continues, leading to a short-term oversold reading according to RSI.
*** Stocks highlighted are for information purposes only and should not be considered as advice to purchase or to sell mentioned securities. As always, the use of technical and fundamental analysis is encouraged in order to fine tune entry and exit points to average seasonal trends.
Stocks Entering Period of Seasonal Strength Today:
Subscribers – Click on the relevant link to view the full profile. Not a subscriber? Signup here.
This content is exclusive to subscribers of EquityClock.com. Please Log In or Subscribe to proceed.
The Markets
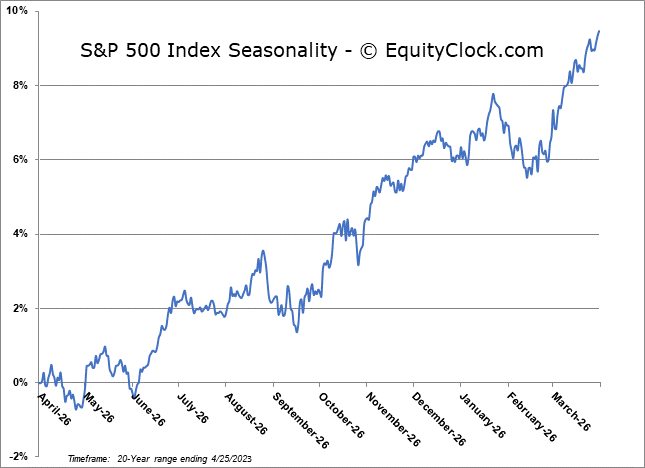
Stocks sold off on Tuesday as concerns in the banking industry re-emerged follow the release of the first quarter earnings results from beleaguered bank First Republic (FRC). The S&P 500 Index closed down by 1.58%, moving out of the range of overhead resistance between 4100 and 4200 and breaking below short-term support at the 20-day moving average. Following weeks of degradation in upside momentum, MACD has triggered a new sell signal as the technical indicator crosses below its signal line. The bearish cross occurs at a level lower than the sell signal that preceded it in February, continuing a path of lower-highs with respect to the momentum indicators that has been apparent since August of last year. It remains clear that the market lacks the “lift-off” capacity to break the range of resistance that it has been struggling with for many months and a retracement lower looks to be required in order to re-invigorate buying demand. As highlighted last week in our report to subscribers, the break below the ascending wedge pattern on the hourly chart of the benchmark projects a downside target towards the rising 200-hour moving average, a level that is now around 20-points below at 4050. The benchmark has become short-term oversold, but momentum indicators on this shorter-term view have yet to break their declining trend that they have been in throughout the month of April. Just a few more days remain in the best six months of the year trend for stocks and the MACD sell signal that has been revealed on the daily chart is pretty compelling to follow-through with the action that it suggests; historically, MACD sell signals triggered on the daily chart within the vicinity of the average peak to the best six months of the year trend for stocks at the start of May have typically provided ideal exit points to rotate away from risk (stocks) and towards safe-haven alternatives with a view to re-enter sometime later in the summer/early fall upon a peak in summer volatility.
This content is exclusive to subscribers of EquityClock.com. Please Log In or Subscribe to proceed.
Seasonal charts of companies reporting earnings today:
S&P 500 Index
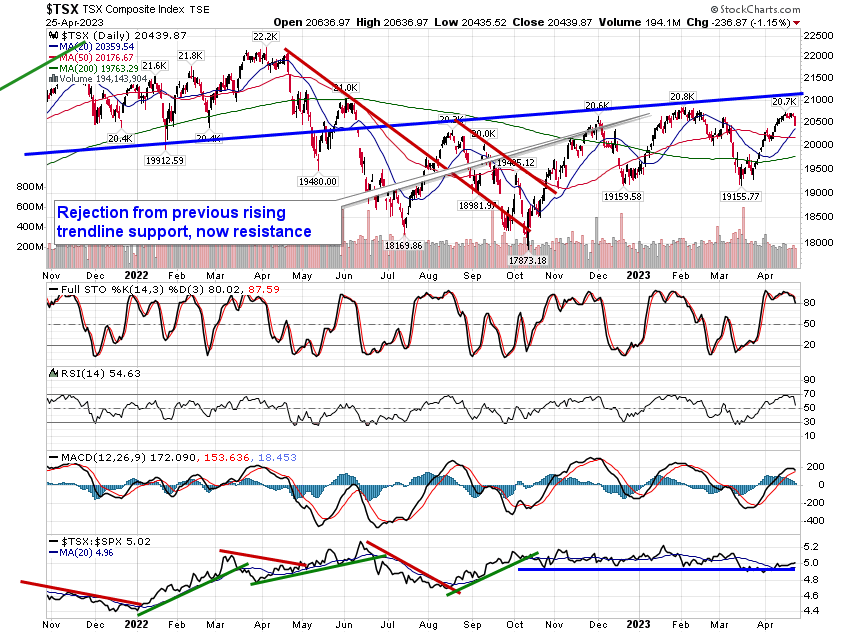
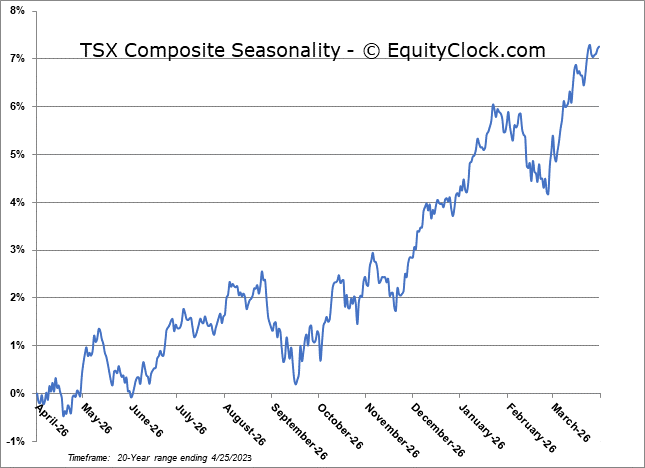
TSE Composite
If you wish to be excluded from this distribution, simply reply to this email requesting to have your email removed from our list or click on the following link: **Note: You will continue to have access to our reports so long as your subscription at Equity Clock remains active. To manage your subscription to our service, please visit the Members Section at https://charts.equityclock.com/members.


 Seasonal Chart")

 Seasonal Chart")