US Dollar Index showing a double bottom at the February low, a technical event that should concern equity investors.
*** Stocks highlighted are for information purposes only and should not be considered as advice to purchase or to sell mentioned securities. As always, the use of technical and fundamental analysis is encouraged in order to fine tune entry and exit points to average seasonal trends.
Stocks Entering Period of Seasonal Strength Today:
Subscribers – Click on the relevant link to view the full profile. Not a subscriber? Signup here.


Super Simple Seasonal Portfolio
This content is exclusive to subscribers of EquityClock.com. Please Log In or Subscribe to proceed.
The Markets
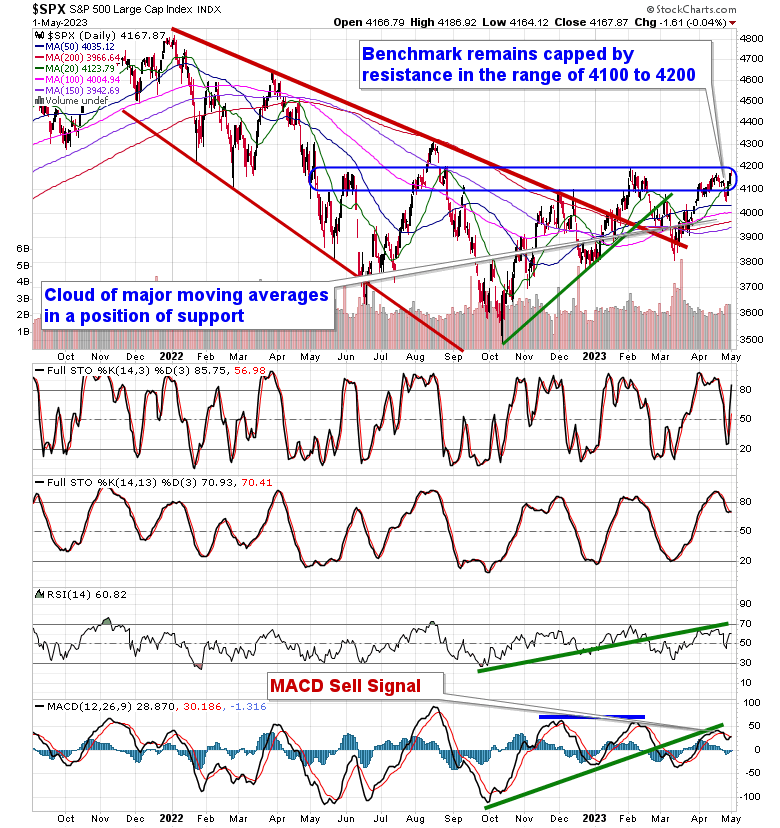
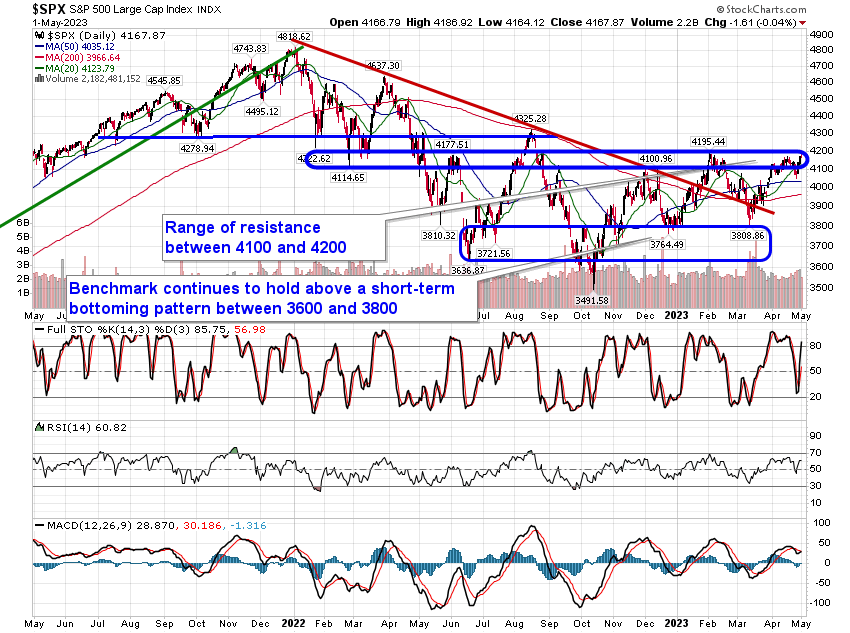
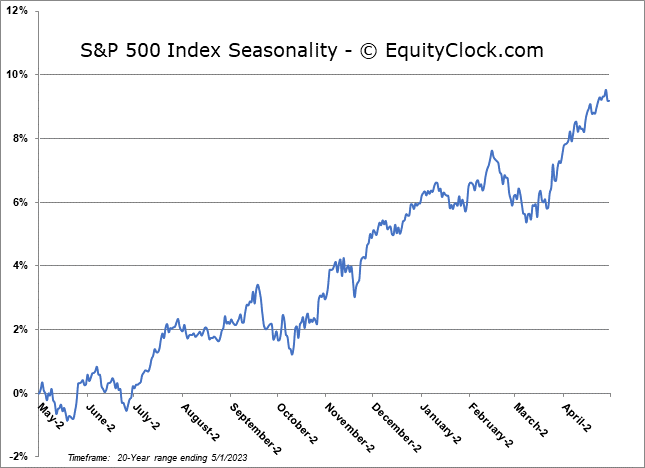
Stocks gyrated around the flat-line to start the new week and the new month as investors brace for the Fed policy announcement on Wednesday. The S&P 500 Index closed essentially unchanged, remaining within the range of resistance between 4100 and 4200. Support continues to be implied by the confluence of major moving averages in the range of 3950 to 4050. This span of support effectively marks the limits denoted by the 50 and 200-day moving averages, which are starting to converge on one another as the shorter-term average flat-lines while the longer-term average continues to rebound. Ultimately, the lack of a parallel rising path of these moving averages has yet to express a defined bullish backdrop, one where momentum is on your side to carry risk assets higher over a prolonged period. MACD remains on a sell signal that was triggered last week, ahead of the month-end rebound. Seasonally, stocks have tended to remain afloat through the first week of May, but we are at the end of the best six month trend for stocks, warranting a greater scrutiny of the technicals to provide the signal of whether to take down risk in portfolios as the market transitions into a period of risk-aversion.
This content is exclusive to subscribers of EquityClock.com. Please Log In or Subscribe to proceed.
Seasonal charts of companies reporting earnings today:


 Seasonal Chart")


 Seasonal Chart")


S&P 500 Index
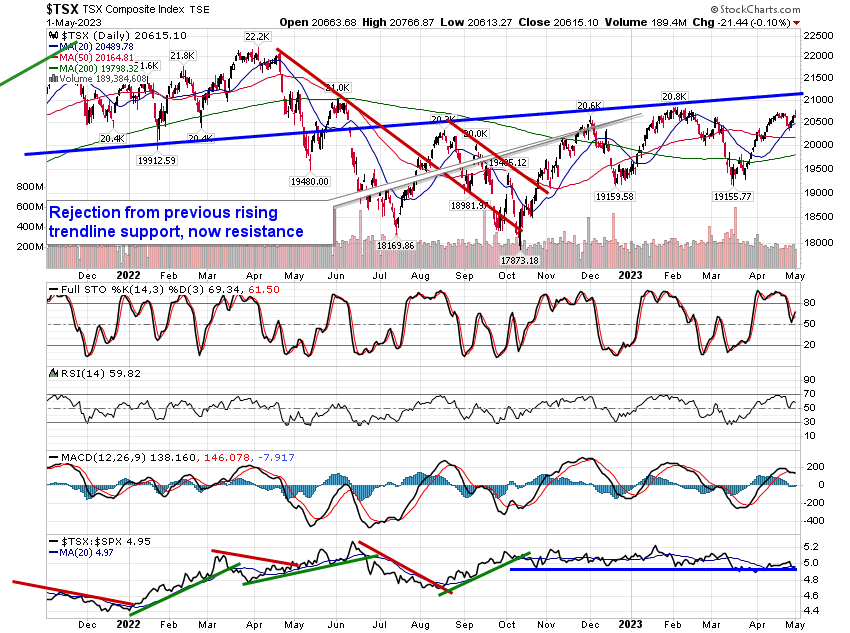
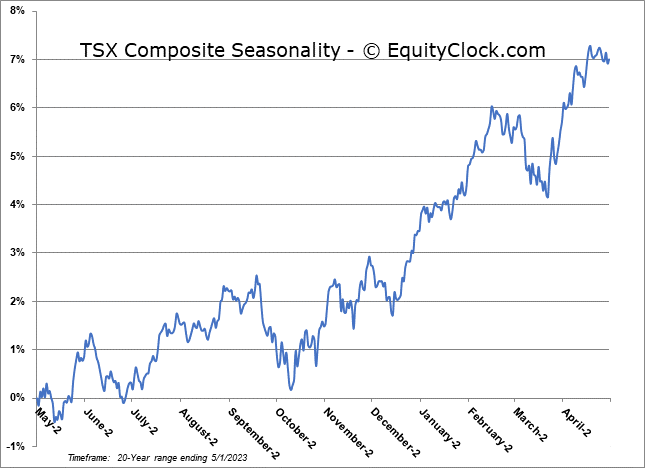
TSE Composite