A short-term head-and-shoulders top on the chart of Bitcoin presents a near-term risk to broader investor sentiment.
*** Stocks highlighted are for information purposes only and should not be considered as advice to purchase or to sell mentioned securities. As always, the use of technical and fundamental analysis is encouraged in order to fine tune entry and exit points to average seasonal trends.
Stocks Entering Period of Seasonal Strength Today:
Subscribers – Click on the relevant link to view the full profile. Not a subscriber? Signup here.


Super Simple Seasonal Portfolio
This content is exclusive to subscribers of EquityClock.com. Please Log In or Subscribe to proceed.
The Markets
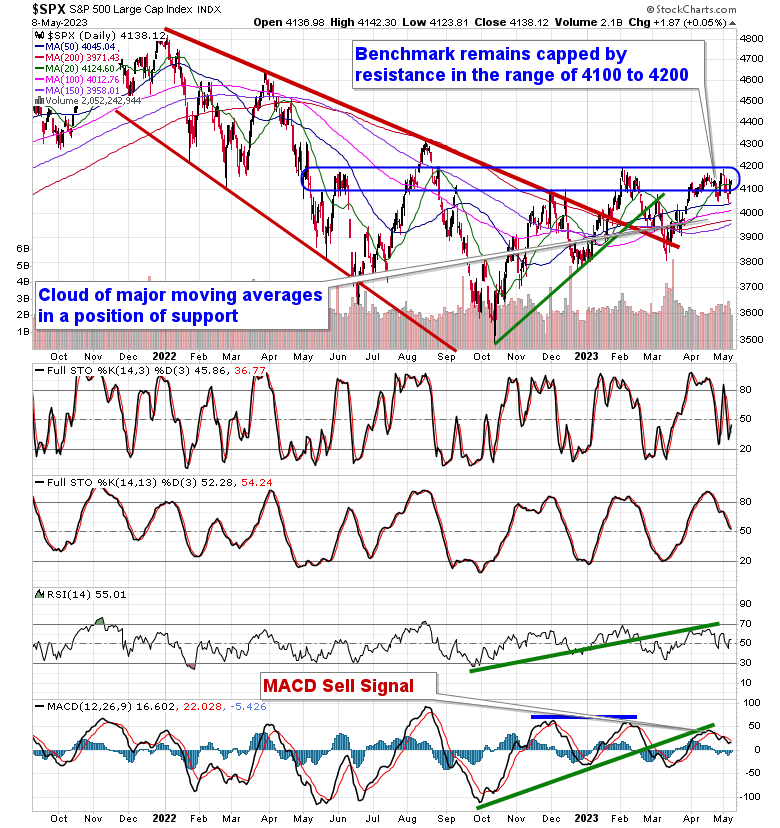
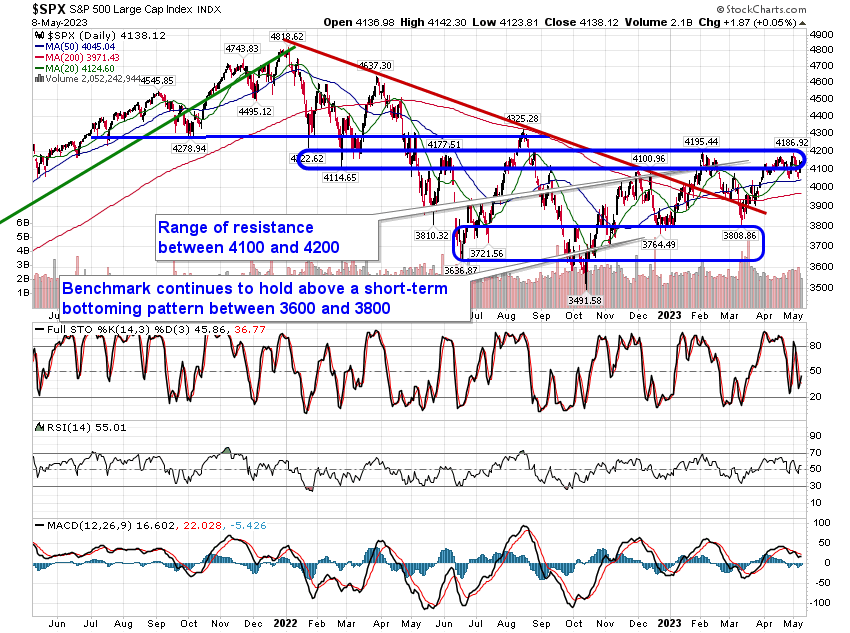
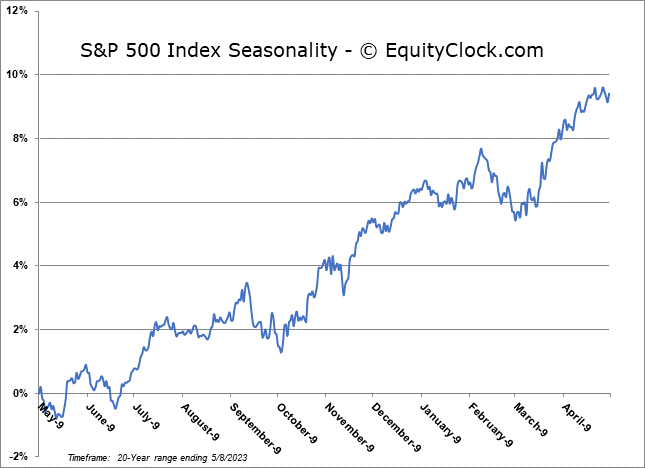
Stocks closed mixed on Monday as investors weigh the resiliency of the labor market with ongoing concerns pertaining to a banking crisis, uncertainty over the debt ceiling limit, and the onset of an economic recession. The S&P 500 Index edged higher by a mere five basis points (0.05%), closing, yet again, in the range of resistance between 4100 and 4200. Support at the congestion of major moving averages between 3950 and 4050 continues to keep this market afloat. Momentum indicators have rolled over from their peak charted in the middle of April, leaving the benchmark on a sell signal, according to MACD. During this period of risk-aversion for the broader equity market between May and October, investors typically need reason to send stocks definitively higher over a sustainable timeframe, but with many uncertainties plaguing the market, it is difficult to foresee the buying demand materialize to break the significant barrier overhead.
This content is exclusive to subscribers of EquityClock.com. Please Log In or Subscribe to proceed.
Seasonal charts of companies reporting earnings today:


 Seasonal Chart")


S&P 500 Index
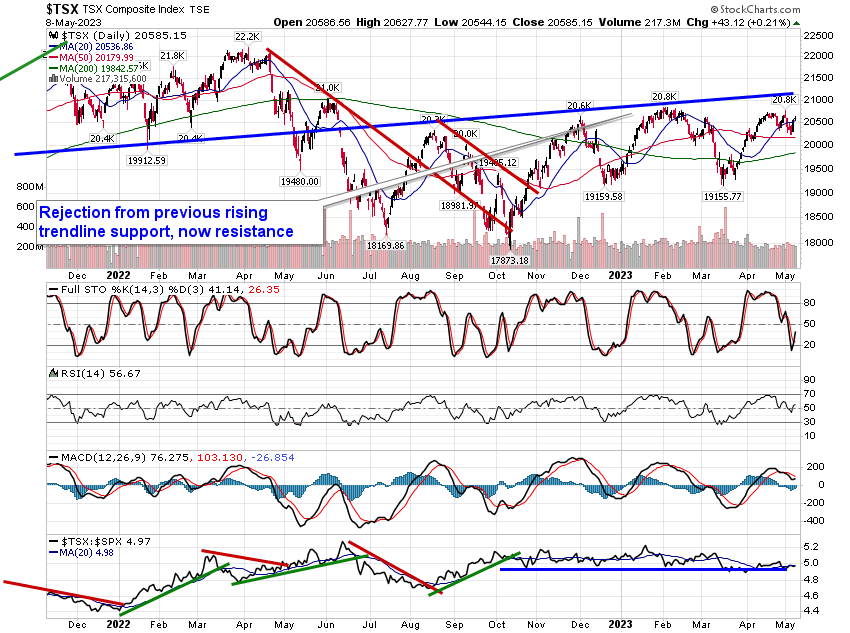
TSE Composite