The trajectory of loan activity has taken an interesting shift, diverging from seasonal norms, as lending standards tighten.
*** Stocks highlighted are for information purposes only and should not be considered as advice to purchase or to sell mentioned securities. As always, the use of technical and fundamental analysis is encouraged in order to fine tune entry and exit points to average seasonal trends.
Stocks Entering Period of Seasonal Strength Today:
Subscribers – Click on the relevant link to view the full profile. Not a subscriber? Signup here.


Super Simple Seasonal Portfolio
This content is exclusive to subscribers of EquityClock.com. Please Log In or Subscribe to proceed.
The Markets
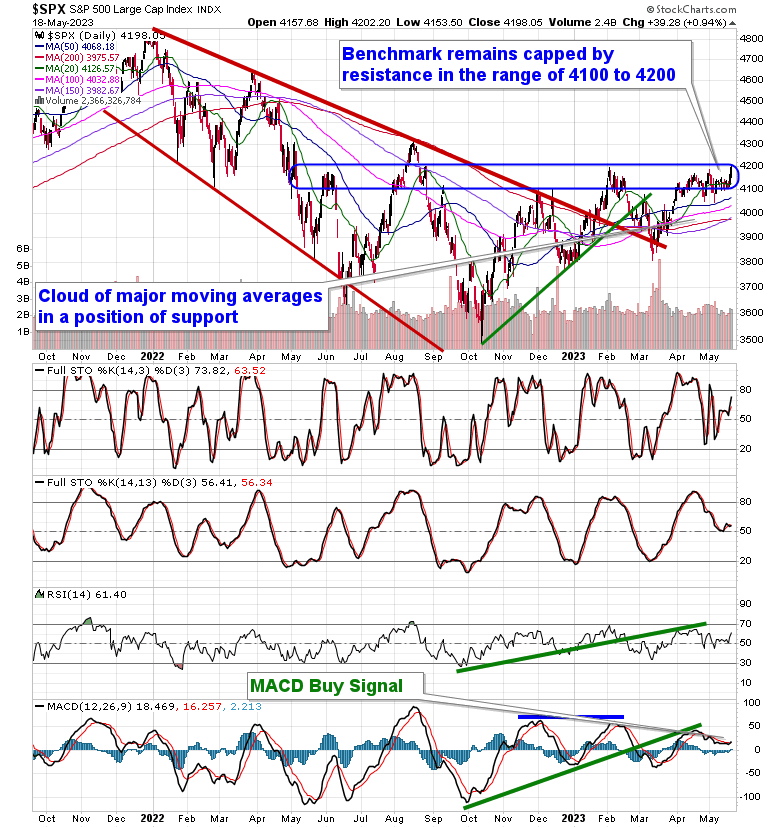
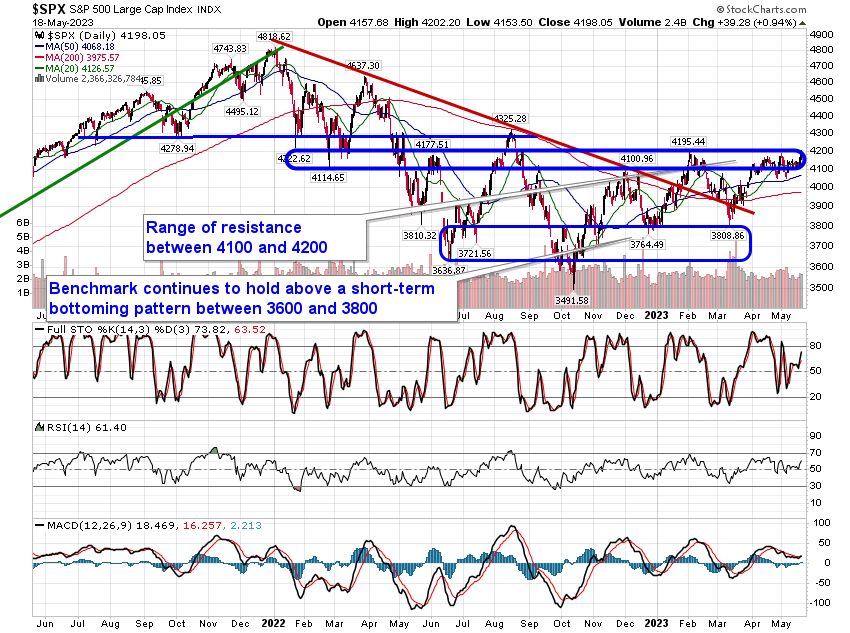
Stocks jumped for a second day as investors express their optimism that a debt deal between Republicans and Democrats will be reached in time to avoid default. The S&P 500 Index gained 0.94%, reaching up to the upper limit of the range of resistance that the benchmark has been struggling with for months between 4100 and 4200. Support remains implied around the congestion of major moving averages between 3950 and 4050. Momentum indicators have started to hook higher again with MACD triggering a new buy signal as it crosses back above its signal line. Instantly, the benchmark appears to be adopting a positive tilt, but while further strength is possible from here attributed to a debt ceiling deal and the positivity that surrounds the Memorial Day holiday week ahead, we still must question as to what will carry the baton beyond this short-term optimism to drive prices higher sustainably over the months ahead. A buy the rumour, sell the news scenario is suspected as economic fundamentals continue to erode.
This content is exclusive to subscribers of EquityClock.com. Please Log In or Subscribe to proceed.
Seasonal charts of companies reporting earnings today:


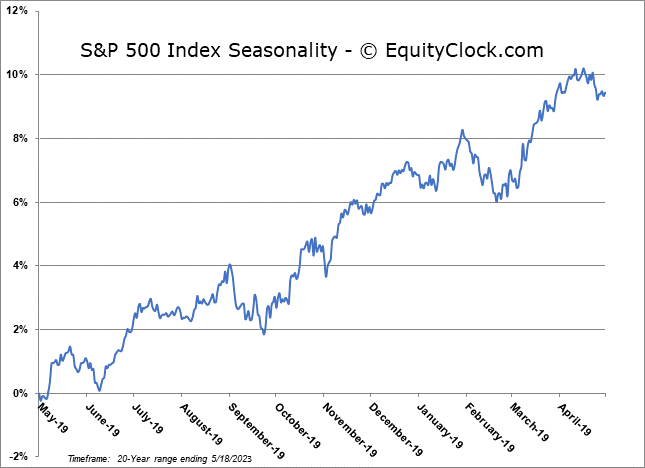
S&P 500 Index
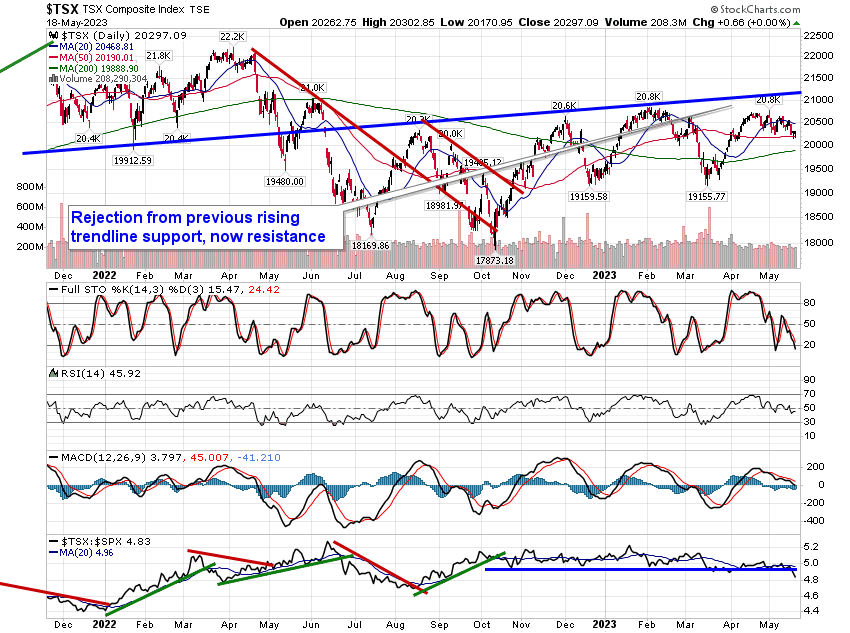
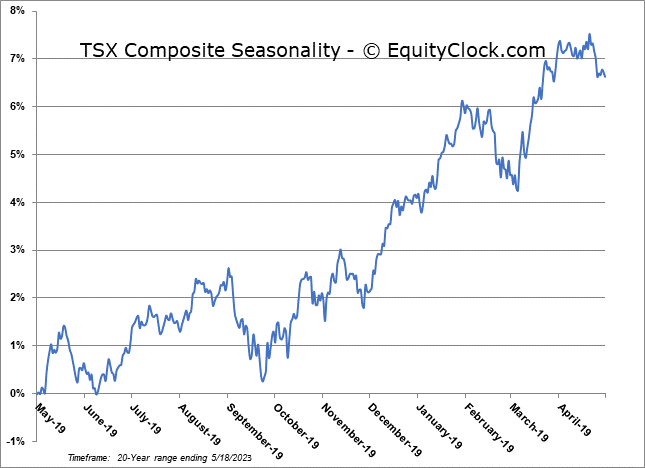
TSE Composite