Despite substantial downward revisions to prior week’s data, the year-to-date change of jobless claims is still running at the highest pace since the years surrounding the Great Financial Crisis.
*** Stocks highlighted are for information purposes only and should not be considered as advice to purchase or to sell mentioned securities. As always, the use of technical and fundamental analysis is encouraged in order to fine tune entry and exit points to average seasonal trends.
Stocks Entering Period of Seasonal Strength Today:
Subscribers – Click on the relevant link to view the full profile. Not a subscriber? Signup here.


Super Simple Seasonal Portfolio
This content is exclusive to subscribers of EquityClock.com. Please Log In or Subscribe to proceed.
The Markets
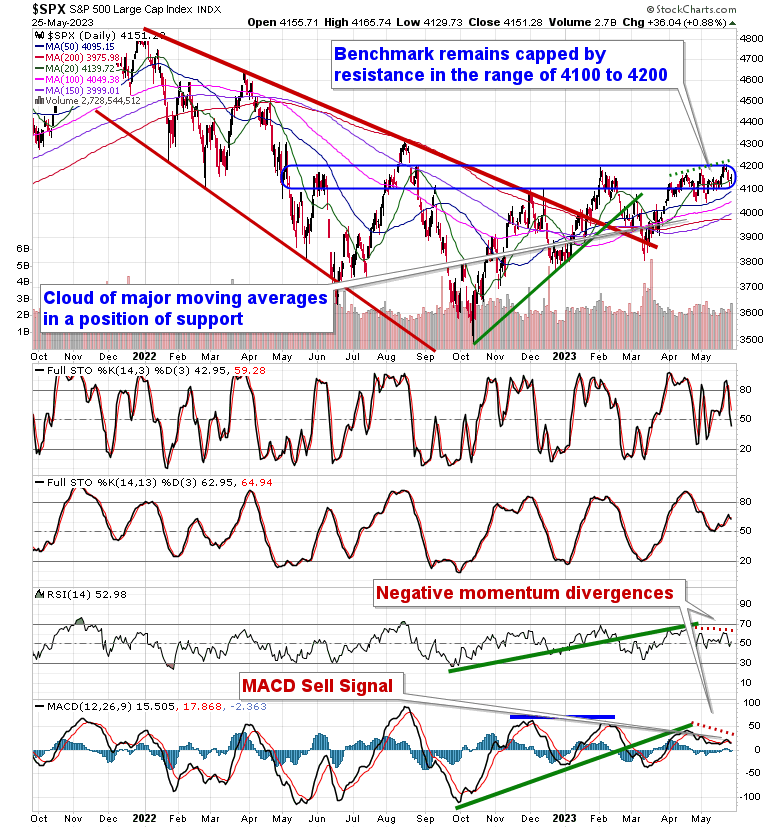
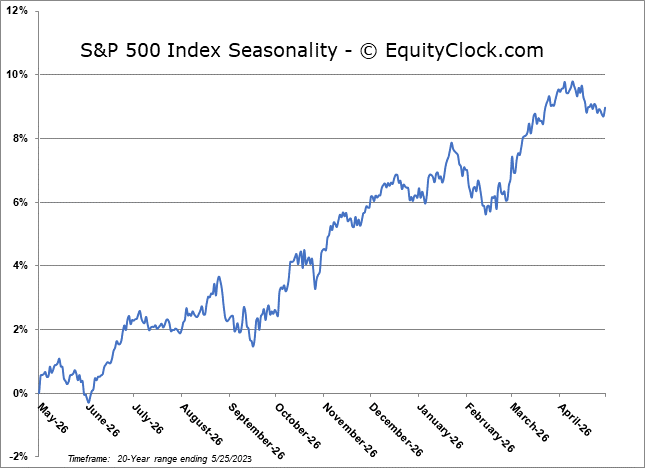
Stocks closed generally mixed on Thursday, but this did not stop the tech-heavy S&P 500 Index from producing a solid gain following blowout earnings from chip-maker Nvidia. The large-cap benchmark closed with a gain of just less than nine-tenths of one percent, remaining within the band of resistance between 4100 and 4200. Support remains implied around the congestion of major moving averages in the range of 3980 to 4080. A divergence between the direction of price and momentum can be seen over the past month where the benchmark is marginally higher than where its was through the middle of April, but MACD and RSI are lower, now hovering around the mid-points to their spans. The opposing directions is very much indicative of the grind that the market finds itself in, not showing much broad upside buying demand and hinting of the loss of traction as it battles with horizontal resistance that has persisted for many months. The market remains within this period of seasonal positivity during the days surrounding the Memorial Day holiday, following which weakness is normal through the month of June, a period known for end-of-quarter mean reversion.
This content is exclusive to subscribers of EquityClock.com. Please Log In or Subscribe to proceed.
Seasonal charts of companies reporting earnings today:

 Seasonal Chart")


S&P 500 Index

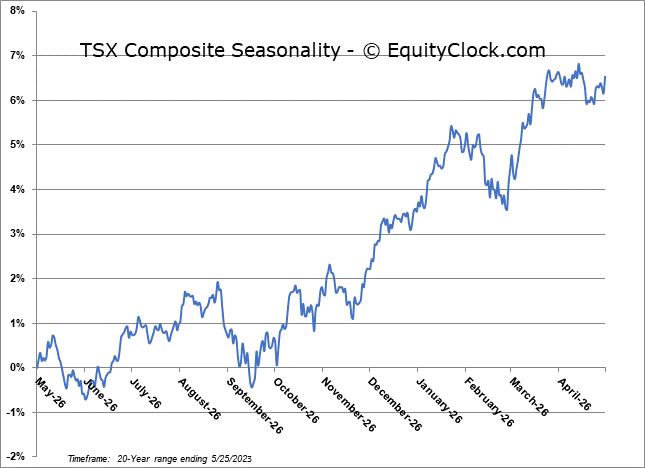
TSE Composite