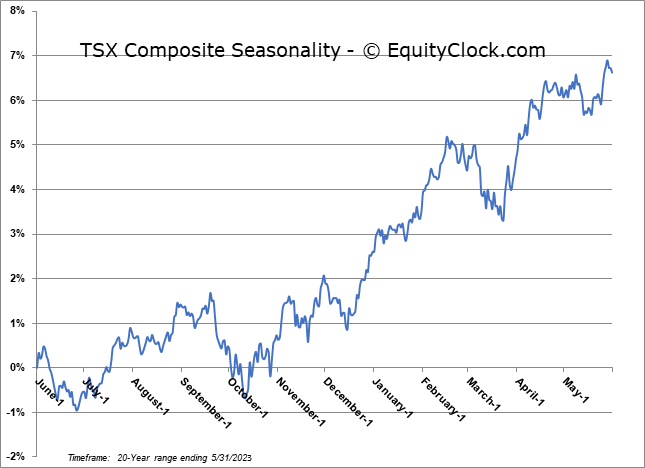
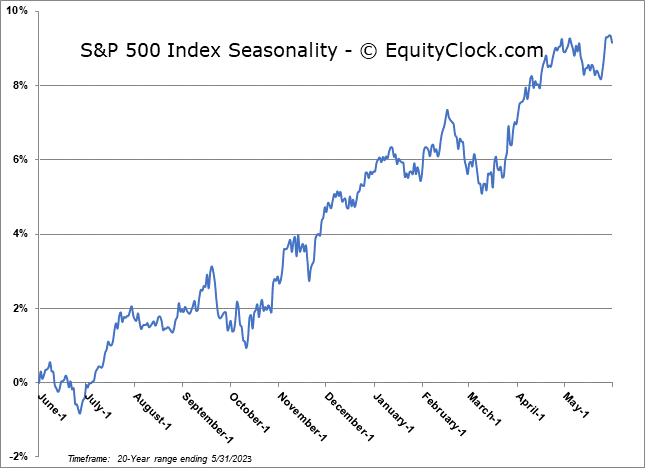
S&P 500 Index has averaged a decline of 0.4% during the month of June, however, 60% of the time the month has been positive over the past two decades.
*** Stocks highlighted are for information purposes only and should not be considered as advice to purchase or to sell mentioned securities. As always, the use of technical and fundamental analysis is encouraged in order to fine tune entry and exit points to average seasonal trends.
Stocks Entering Period of Seasonal Strength Today:
Subscribers – Click on the relevant link to view the full profile. Not a subscriber? Signup here.


Super Simple Seasonal Portfolio
This content is exclusive to subscribers of EquityClock.com. Please Log In or Subscribe to proceed.
The Markets
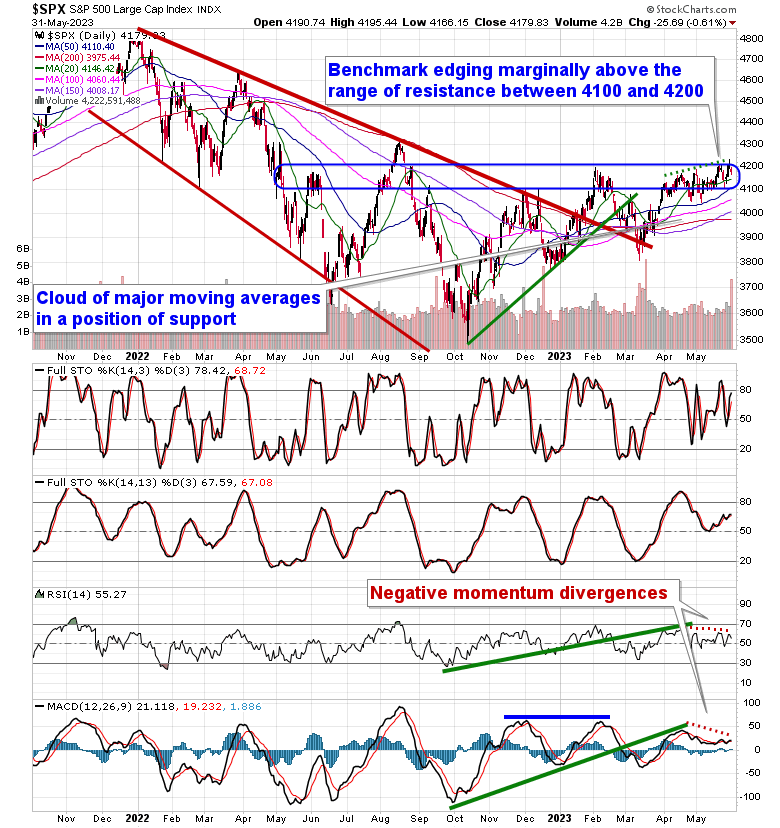
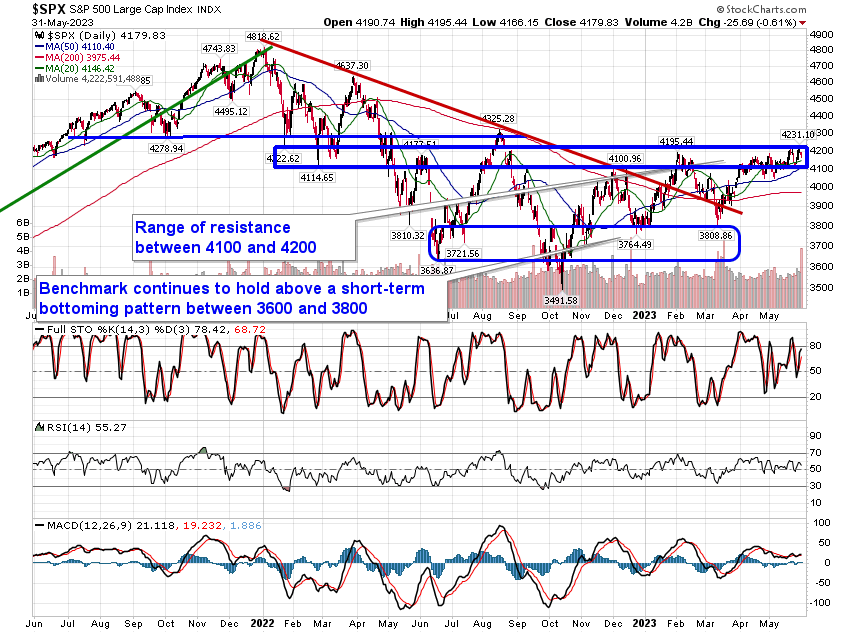
Stocks drifted lower on Wednesday as investors monitored the vote on the US debt ceiling while they conducted end-of-month portfolio re-balancing trades. The S&P 500 Index closed down by six-tenths of one percent, ending back below the pivotal 4200 level that the broader market has been scrutinizing as a level of resistance. A short-term divergence between price and momentum over the past month and a half remains apparent, failing to confirm the new multi-month highs charted in recent days. Support remains apparent at the congestion of major moving averages between 4000 and 4100, a zone that continues to keep this grind higher in prices afloat. The sustainability of the recent strength is certainly in questionable given the lack of breadth, the ongoing degradation in macro economic fundamentals, and the lack-lustre seasonal tendencies (particularly for the month of June) and caution in risk (stocks), generally, remains prudent.
This content is exclusive to subscribers of EquityClock.com. Please Log In or Subscribe to proceed.
Seasonal charts of companies reporting earnings today:


S&P 500 Index
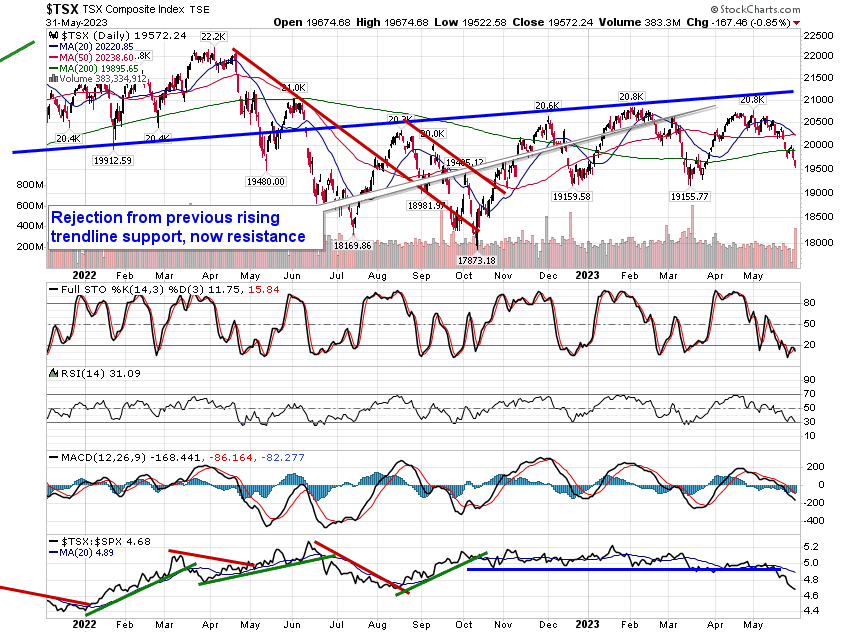
TSE Composite