Instantly, this market has a vastly different appearance than what it was showing just a week ago.
*** Stocks highlighted are for information purposes only and should not be considered as advice to purchase or to sell mentioned securities. As always, the use of technical and fundamental analysis is encouraged in order to fine tune entry and exit points to average seasonal trends.
Stocks Entering Period of Seasonal Strength Today:
Subscribers – Click on the relevant link to view the full profile. Not a subscriber? Signup here.


Super Simple Seasonal Portfolio
This content is exclusive to subscribers of EquityClock.com. Please Log In or Subscribe to proceed.
The Markets
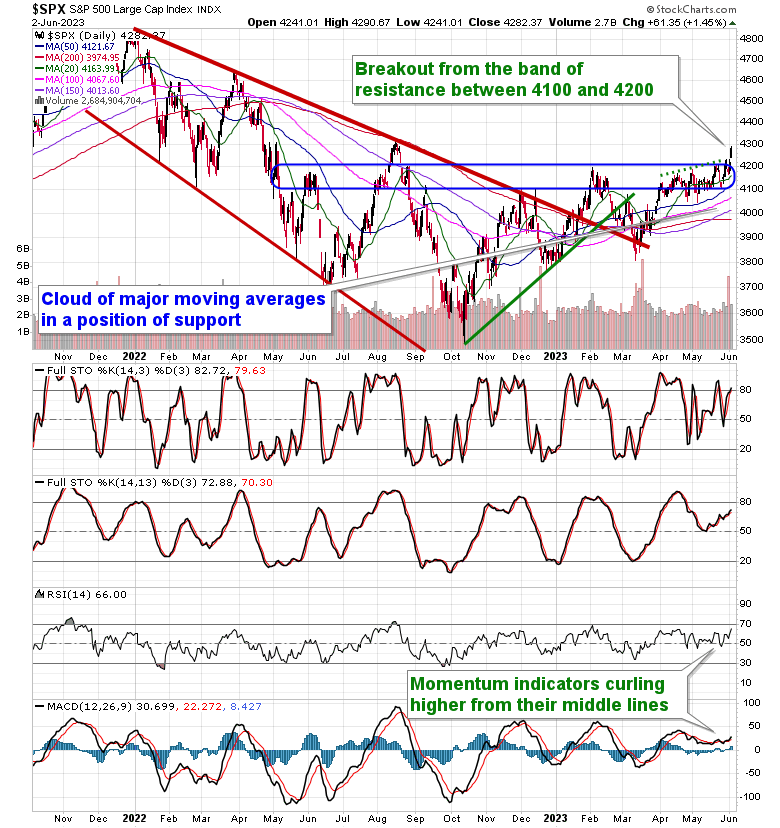
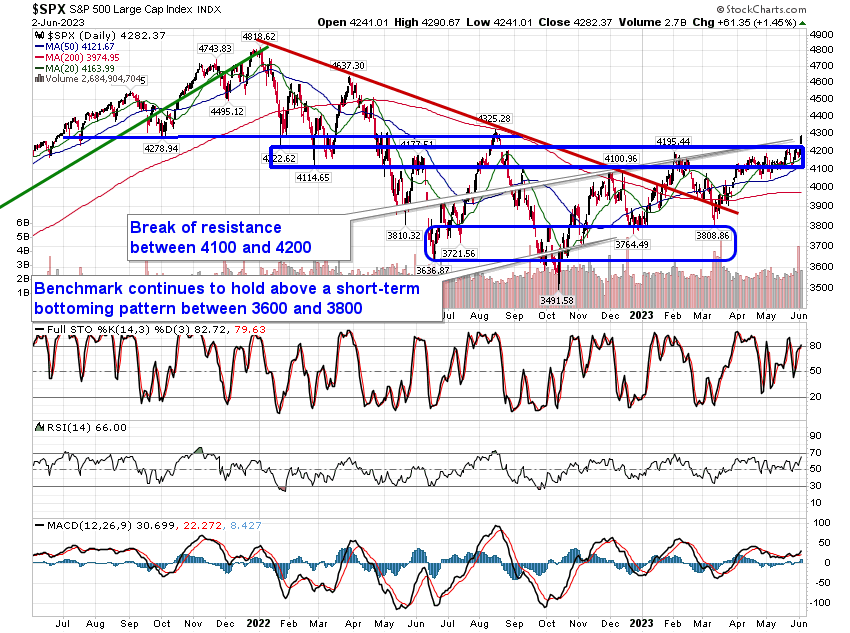
Stocks jumped on Friday as investors cheered the progress of the debt ceiling resolution and embraced the ongoing strength in the labor market. The S&P 500 Index closed with a gain of 1.45%, moving firmly beyond the band of resistance that has capped the benchmark for months between 4100 and 4200. The gap above recent short-term resistance during the Friday session at 4230 instantly defines a level of support, in conjunction with the congestion of rising moving averages between 4000 and 4100. The strength over the past couple of sessions aligning with start of the month inflows has allowed momentum indicators to curl back higher above their middle lines, which is a bullish revelation. For many months, we have been observing a bull-bear battle as the benchmark gyrates between levels of resistance and support, but now that the most formidable hurdle on the upside (4200) has been breached, it is likely making the bears uncomfortable, fuelling a capitulation move as the shorts unwind. This sentiment shift could persist for a few more days, but, in the month ahead, mean reversion is a high likelihood, something that is all too normal for the end of the quarter and end of the first half of the year.
This content is exclusive to subscribers of EquityClock.com. Please Log In or Subscribe to proceed.
Seasonal charts of companies reporting earnings today:


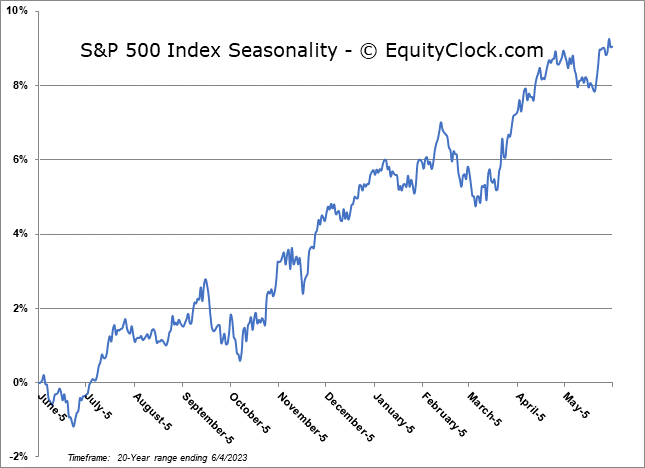
S&P 500 Index
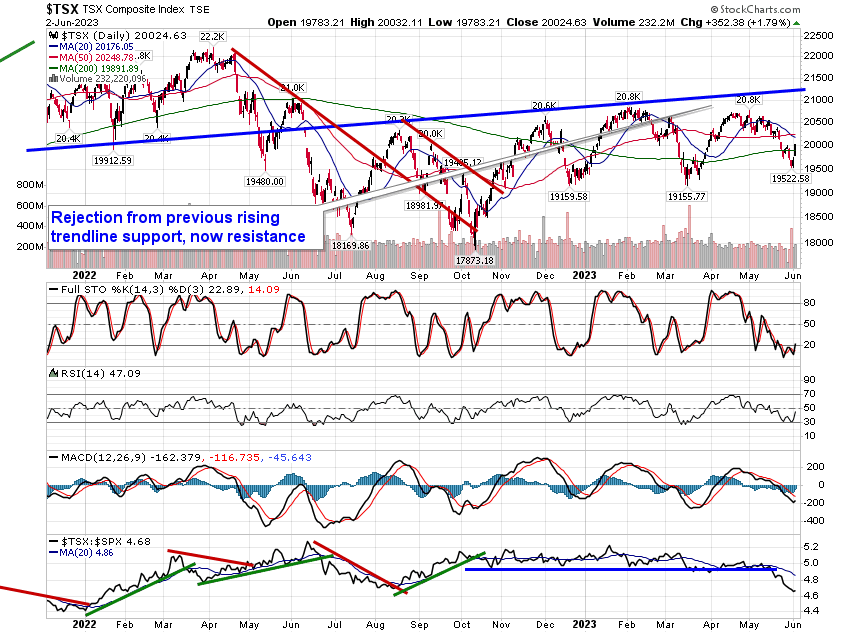
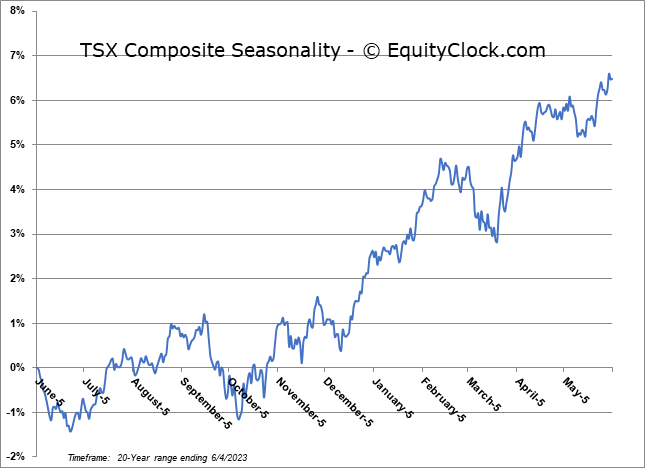
TSE Composite