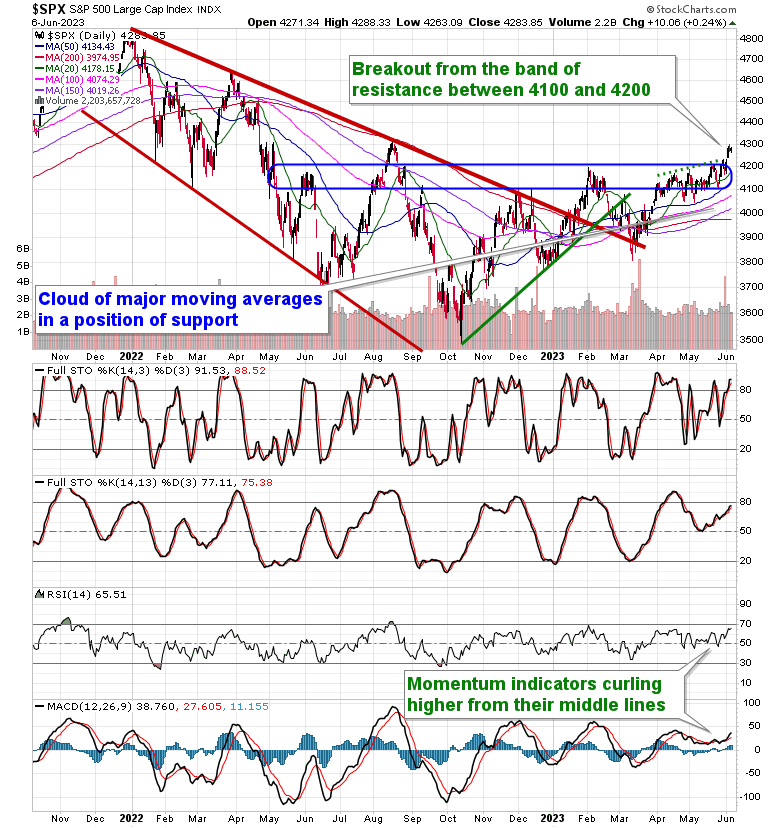
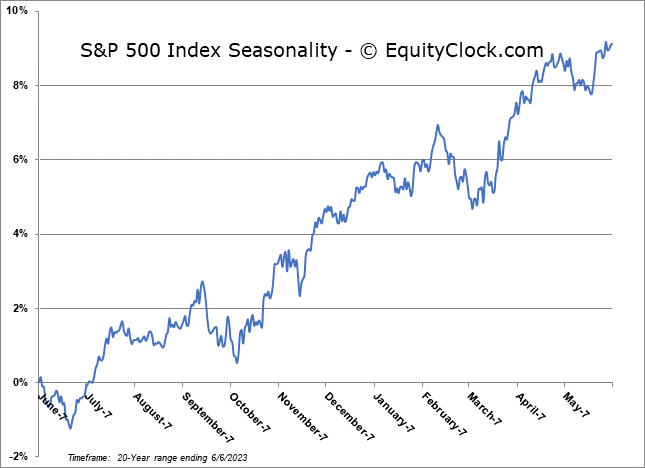
S&P 500 Index testing an important Fibonacci retracement level of last year’s decline.
*** Stocks highlighted are for information purposes only and should not be considered as advice to purchase or to sell mentioned securities. As always, the use of technical and fundamental analysis is encouraged in order to fine tune entry and exit points to average seasonal trends.
Stocks Entering Period of Seasonal Strength Today:
Subscribers – Click on the relevant link to view the full profile. Not a subscriber? Signup here.


Super Simple Seasonal Portfolio
This content is exclusive to subscribers of EquityClock.com. Please Log In or Subscribe to proceed.
The Markets
Stocks closed marginally higher on Tuesday as the rally in stocks starts to broaden out amidst the mean reversion that we have been expecting for the month of June. The S&P 500 Index closed with a gain of just less than a quarter of one percent, remaining above the band of resistance that was broken last week between 4100 and 4200. Major moving averages are maintaining an upward slope, providing support to the rising trend between 4000 and 4100. The benchmark is approaching an important Fibonacci level of last year’s pullback around 4300, which represents a 61.8% retracement of the over 1300-point decline that was realized between January and October of 2022. The hurdle closely aligns with the last major high charted in August of last year, presenting the next formidable hurdle for traders to contend with. So far reaction remains muted, but, in this mean reversion month of June, some kind of digestion around this hurdle appears probable.
This content is exclusive to subscribers of EquityClock.com. Please Log In or Subscribe to proceed.
Seasonal charts of companies reporting earnings today:


S&P 500 Index

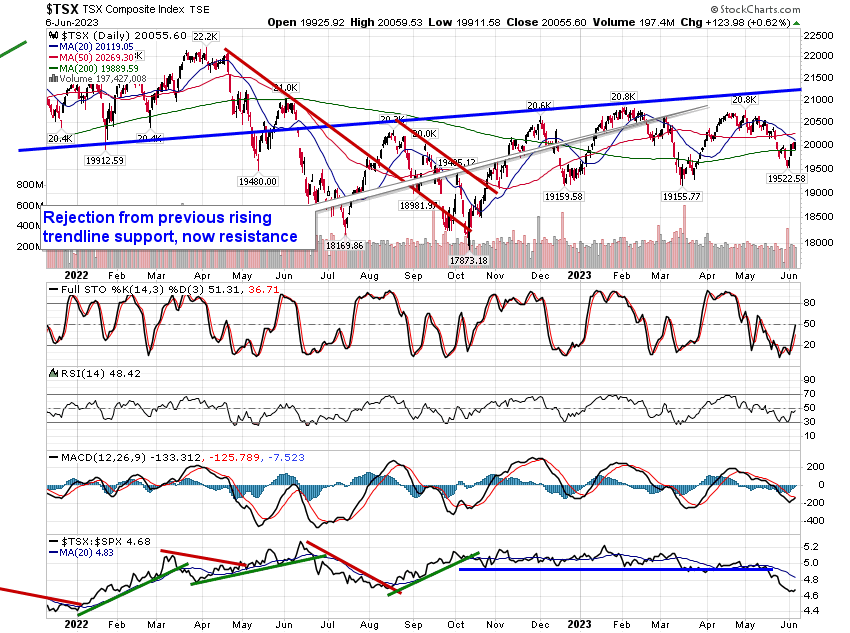
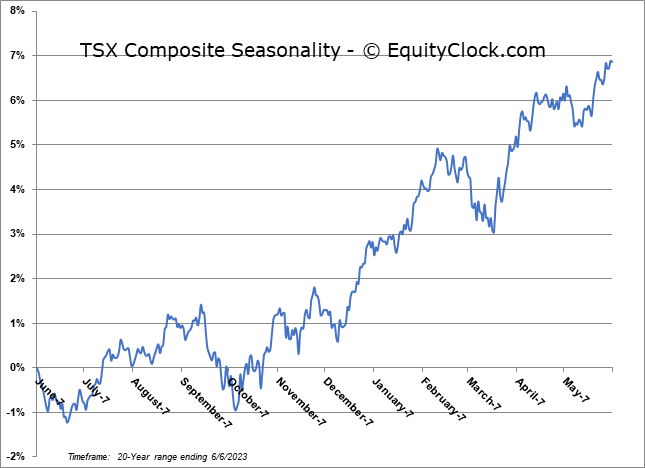
TSE Composite