The shallowest year-to-date decline for jobless claims in decades certainly signifies a labor market that is not as robust as it once was.
*** Stocks highlighted are for information purposes only and should not be considered as advice to purchase or to sell mentioned securities. As always, the use of technical and fundamental analysis is encouraged in order to fine tune entry and exit points to average seasonal trends.
Stocks Entering Period of Seasonal Strength Today:
Subscribers – Click on the relevant link to view the full profile. Not a subscriber? Signup here.


Super Simple Seasonal Portfolio
This content is exclusive to subscribers of EquityClock.com. Please Log In or Subscribe to proceed.
The Markets
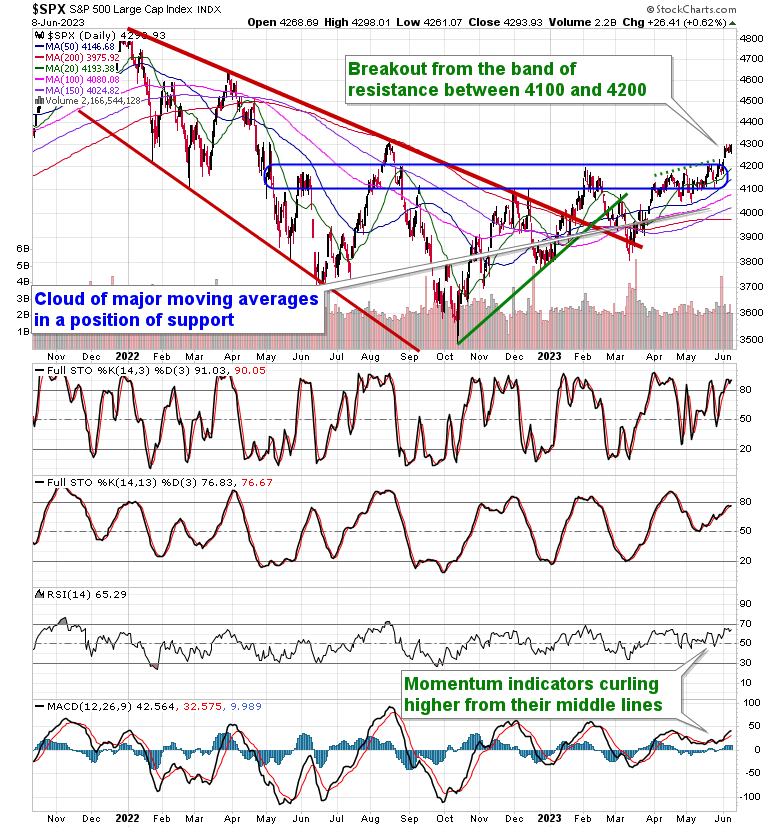
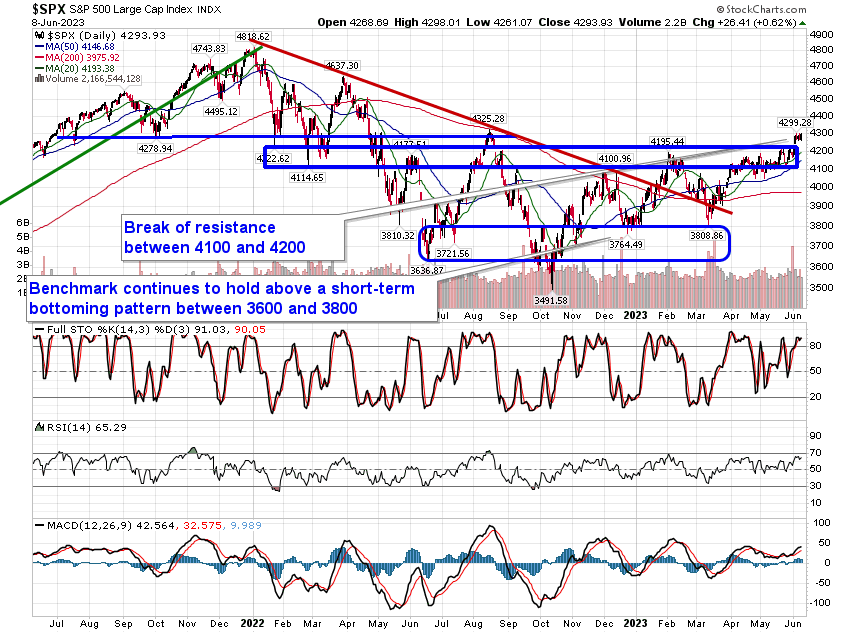
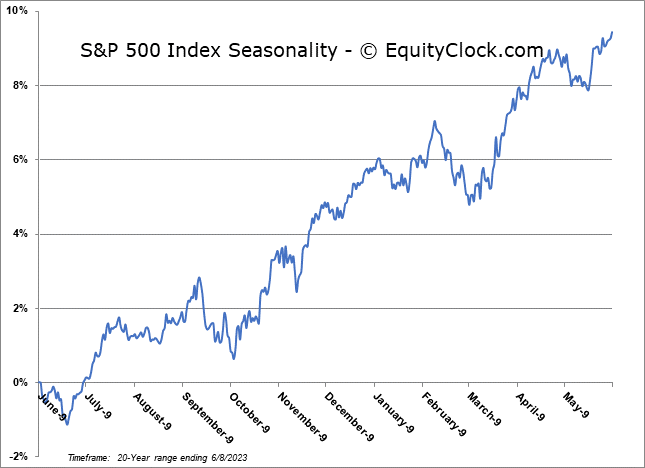
Stocks pushed higher on Thursday as a result of much weaker than expected economic data that took some steam away from the recent rise of treasury yields and the commensurate rise in the US Dollar. The S&P 500 Index ended the day up by just over six-tenths of one percent, continuing to peg itself to the psychologically important 4300 level and the 61.8% retracement zone of last year’s decline. While a cap around this hurdle, also aligning with last August’s high, presents the reasonable prospect of lending itself to the mean reversion that we have been anticipating before the quarter comes to a close, the appearance of a bull-flag pattern cannot be dismissed. The setup is derived by the back-to-back strong up-days on June 1st and 2nd, following the resolution of the debt ceiling limit, charting the flag-pole and then the consolidation this week below the postulated resistance at 4300. This bullish setup could easily fuel another up-shoot before buying exhaustion sets in. Support remains persistent at the congestion of major moving averages between 4000 and 4100, and the recently broken band of resistance between 4100 and 4200 provides another hurdle to shoot off of on the long side. The benchmark has yet to break its rising intermediate path stemming from the October low, preventing the adoption of outright bearish bets against the market while this positive tilt persists. Seasonally, stocks tend to see a digestion of the year’s strength, so far, during the month of June as portfolio managers rebalance from this year’s winners (technology) and towards the laggards (materials, industrials, financials, energy).
This content is exclusive to subscribers of EquityClock.com. Please Log In or Subscribe to proceed.
Seasonal charts of companies reporting earnings today:


S&P 500 Index
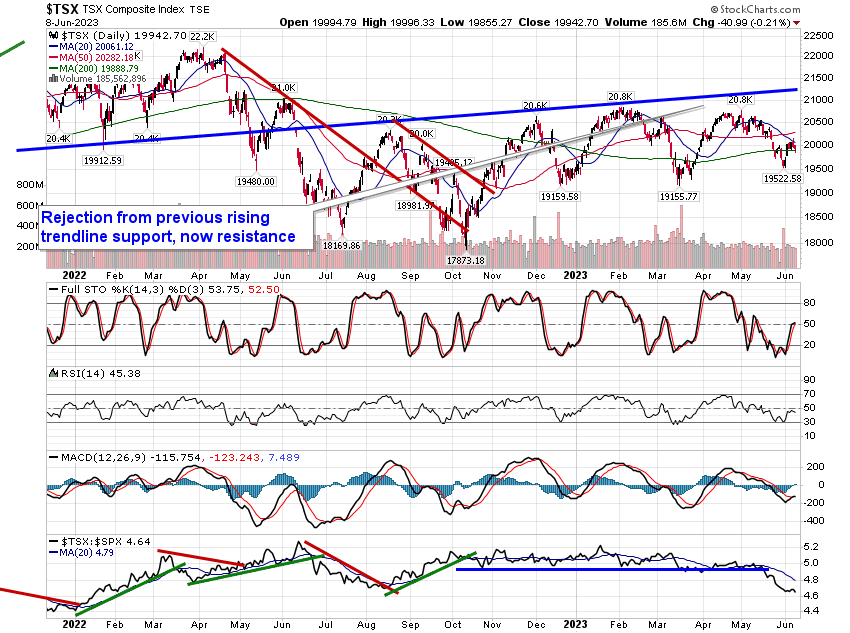
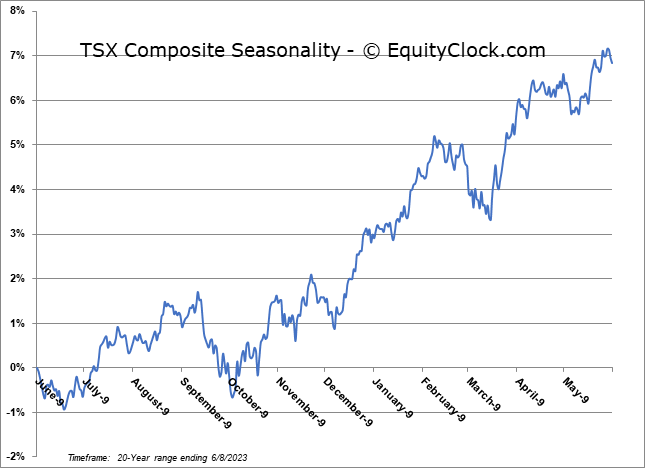
TSE Composite