It is essentially unprecedented to see the S&P 500 Index stretched well above its 200-day moving average, but still less than two-thirds of constituents holding this same hurdle as a level of support.
*** Stocks highlighted are for information purposes only and should not be considered as advice to purchase or to sell mentioned securities. As always, the use of technical and fundamental analysis is encouraged in order to fine tune entry and exit points to average seasonal trends.
Stocks Entering Period of Seasonal Strength Today:
Subscribers – Click on the relevant link to view the full profile. Not a subscriber? Signup here.


Super Simple Seasonal Portfolio
This content is exclusive to subscribers of EquityClock.com. Please Log In or Subscribe to proceed.
The Markets
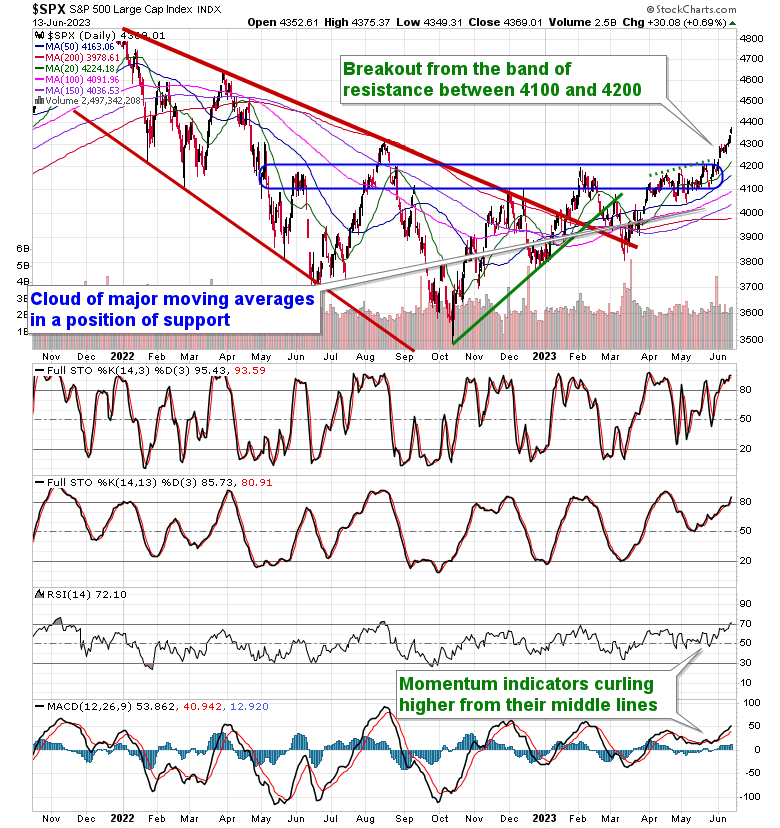
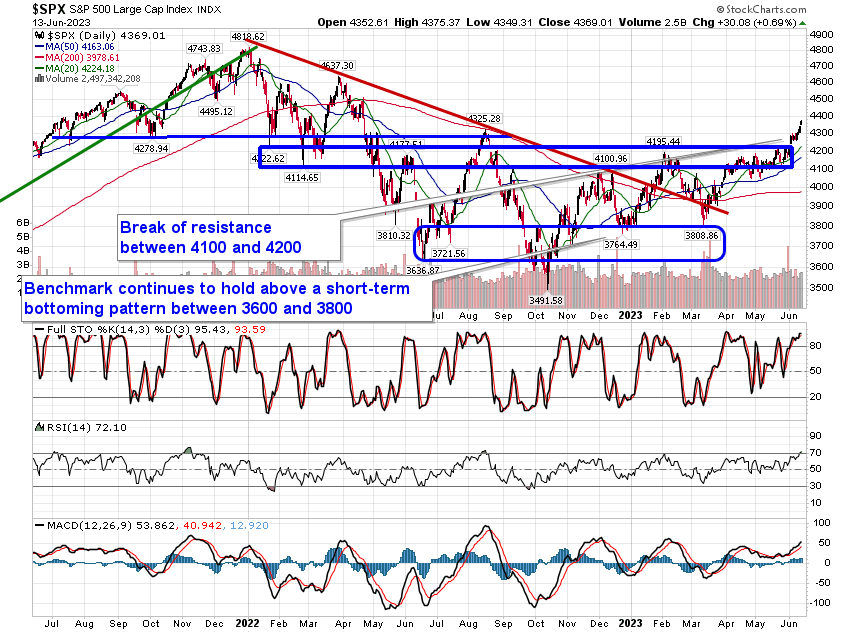
Stocks are remaining relentless with the S&P 500 Index pushing further into new 52-week high territory. The large-cap benchmark finished higher by just less than seven-tenths of one percent, pushing the Relative Strength Index (RSI) into overbought territory above 70 for the first time since last August. The benchmark is stretched to the upside in the short-term according to any number of measures, but this hasn’t alleviated buying demand now that the breakout above significant resistance at 4200 has been achieved. Support remains apparent at the congestion of rising major moving averages, now between 4000 and 4160. This market has yet to show the stagnant tendencies that are normal for the off-season for stocks between May and October, but the next two weeks could shake things up given the onset of the first of the two weakest spans for the market that traditionally warrants limiting risk in investment portfolios until the average summer rally period begins at month-end.
This content is exclusive to subscribers of EquityClock.com. Please Log In or Subscribe to proceed.
Sectors and Industries entering their period of seasonal strength:


Analysis of the Computer Hardware Industry seasonal charts above shows that a Buy Date of June 14 and a Sell Date of October 24 has resulted in a geometric average return of 6.53% above the benchmark rate of the S&P 500 Total Return Index over the past 20 years. This seasonal timeframe has shown positive results compared to the benchmark in 17 of those periods. This is a very good rate of success and the return slightly outperforms the relative buy-and-hold performance of the stock over the past 20 years by an average of 0.14% per year.


Analysis of the Internet Industry seasonal charts above shows that a Buy Date of June 14 and a Sell Date of October 27 has resulted in a geometric average return of 6.85% above the benchmark rate of the S&P 500 Total Return Index over the past 20 years. This seasonal timeframe has shown positive results compared to the benchmark in 17 of those periods. This is a very good rate of success and the return slightly outperforms the relative buy-and-hold performance of the stock over the past 20 years by an average of 0.21% per year.
Seasonal charts of companies reporting earnings today:


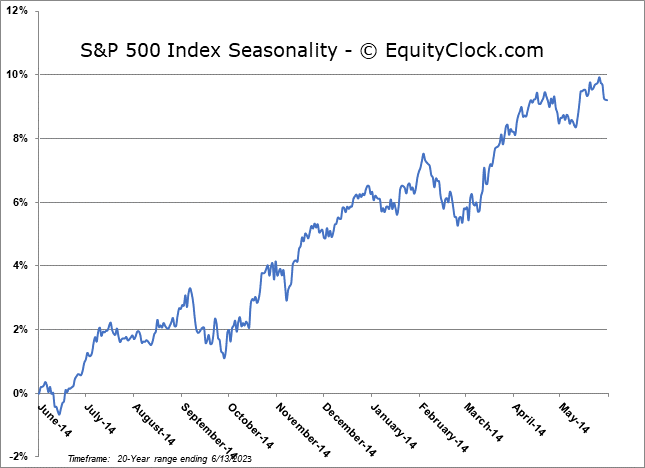
S&P 500 Index
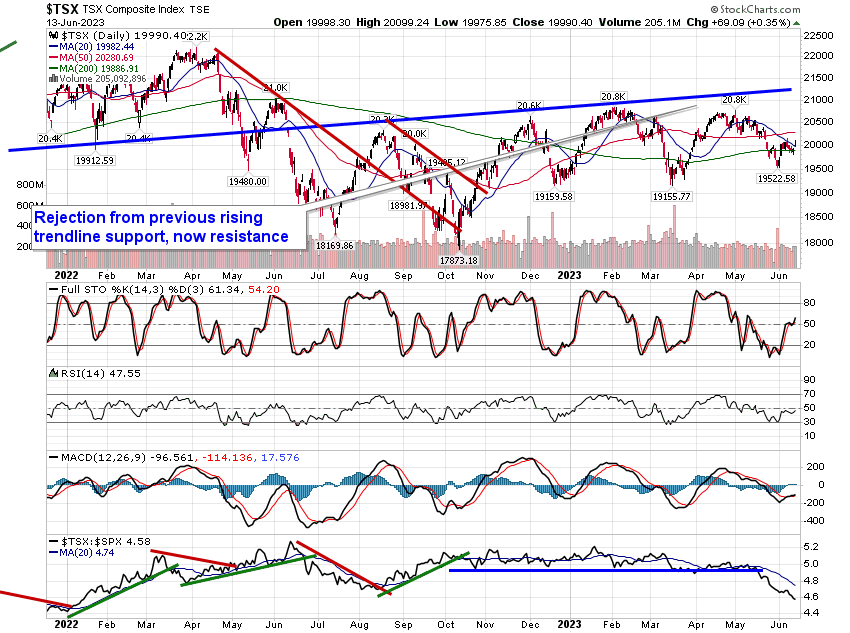
TSE Composite