VIX has printed the first 12-handle since the months prior to the pandemic as the market hovers on the edge of complacency.
*** Stocks highlighted are for information purposes only and should not be considered as advice to purchase or to sell mentioned securities. As always, the use of technical and fundamental analysis is encouraged in order to fine tune entry and exit points to average seasonal trends.
Stocks Entering Period of Seasonal Strength Today:
Subscribers – Click on the relevant link to view the full profile. Not a subscriber? Signup here.


Super Simple Seasonal Portfolio
This content is exclusive to subscribers of EquityClock.com. Please Log In or Subscribe to proceed.
The Markets
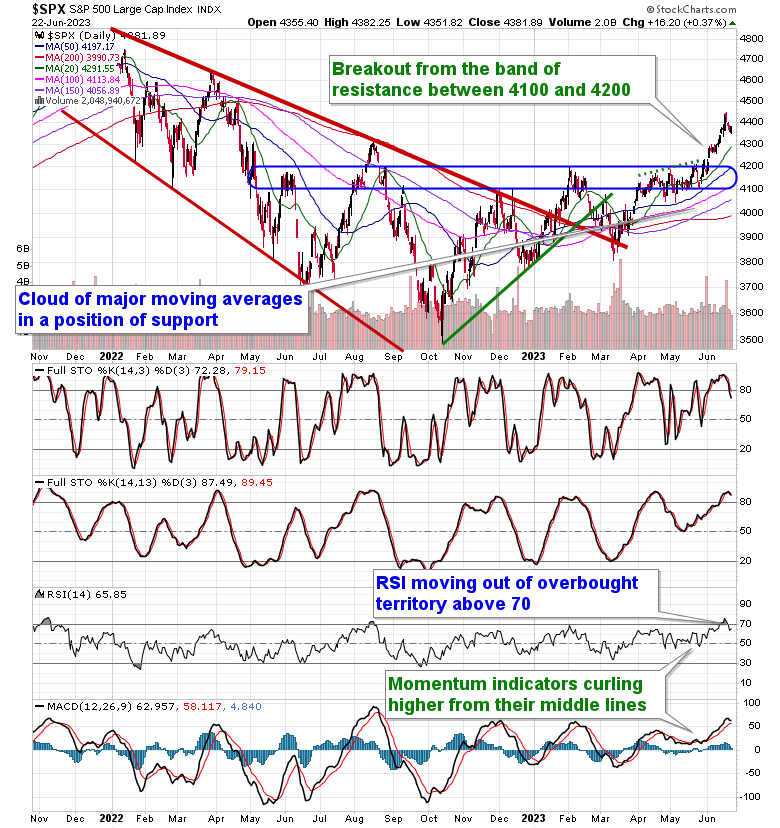
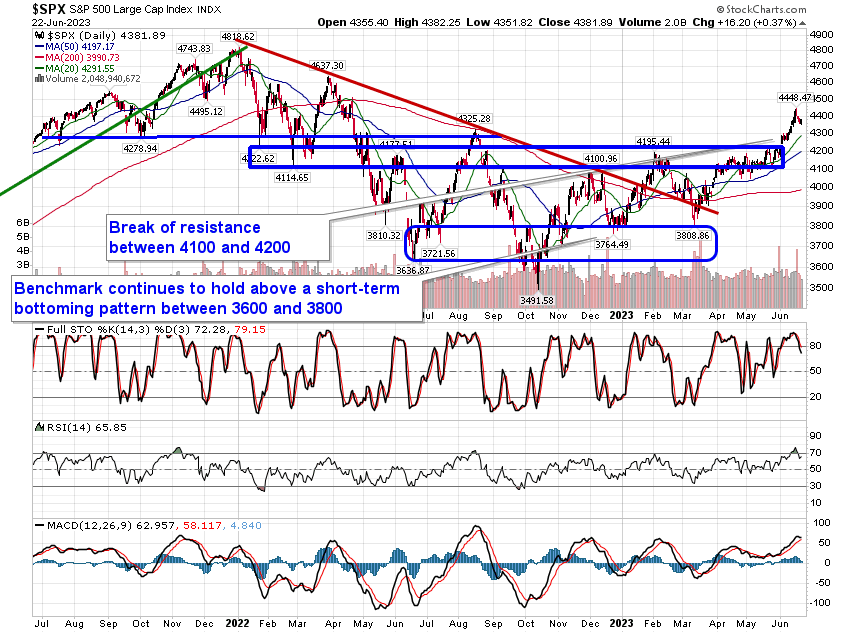
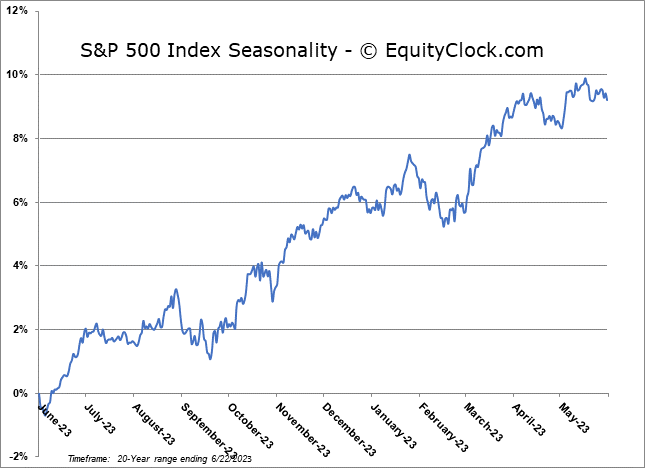
Stocks traded mixed on Thursday as some of the growth centric names saw a reprieve from recent selling pressures, while core-cyclical sectors (energy, financials, industrials, and materials) slipped amidst ongoing macro-fundamental uncertainties. The S&P 500 Index closed with a gain of just less than four-tenths of one percent, remaining below the highs set in the previous session and keeping the short-term path pointed lower. Support remains implied around major moving averages, which have fanned out in recent weeks, providing characteristics of a bull market trend. The 20-day moving average presently sits at 4291, while the 50-day moving average sits just below the significant level of horizontal from which the benchmark broke out of around 4200. Momentum indicators have curled lower with the Relative Strength Index falling out of overbought territory and MACD seemingly poised to chart a bearish crossover of its signal line in the days ahead. A few more days remain in this normal mean-reversion pattern that typically plays out before the end of the second quarter, after which window dressing and start of quarter/second half of the year fund inflows typically support stocks through the middle of July in what is known as the summer rally period.
This content is exclusive to subscribers of EquityClock.com. Please Log In or Subscribe to proceed.
Seasonal charts of companies reporting earnings today:


S&P 500 Index
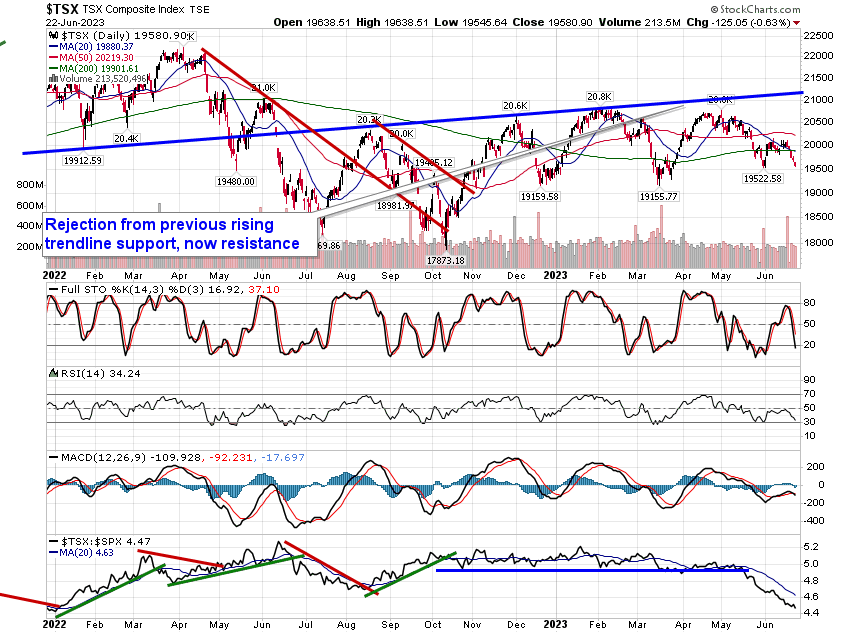
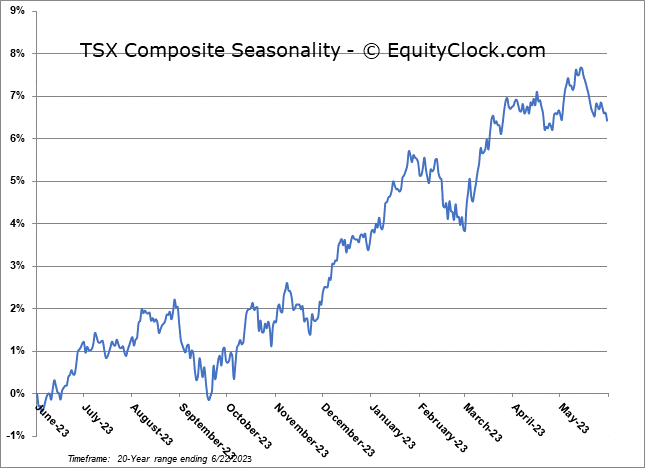
TSE Composite