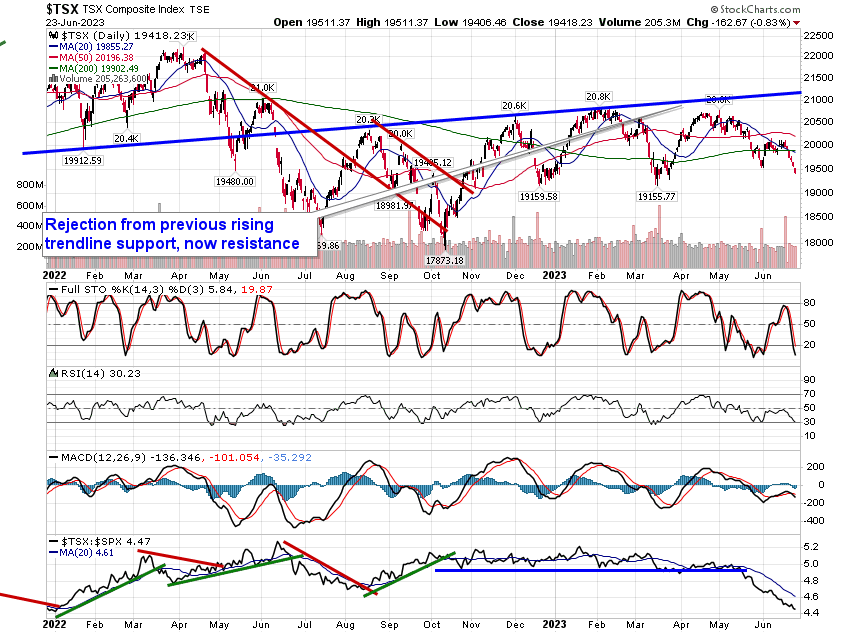
Gauges of risk sentiment turning lower from horizontal points of resistance.
*** Stocks highlighted are for information purposes only and should not be considered as advice to purchase or to sell mentioned securities. As always, the use of technical and fundamental analysis is encouraged in order to fine tune entry and exit points to average seasonal trends.
Stocks Entering Period of Seasonal Strength Today:
Subscribers – Click on the relevant link to view the full profile. Not a subscriber? Signup here.


Super Simple Seasonal Portfolio
This content is exclusive to subscribers of EquityClock.com. Please Log In or Subscribe to proceed.
The Markets
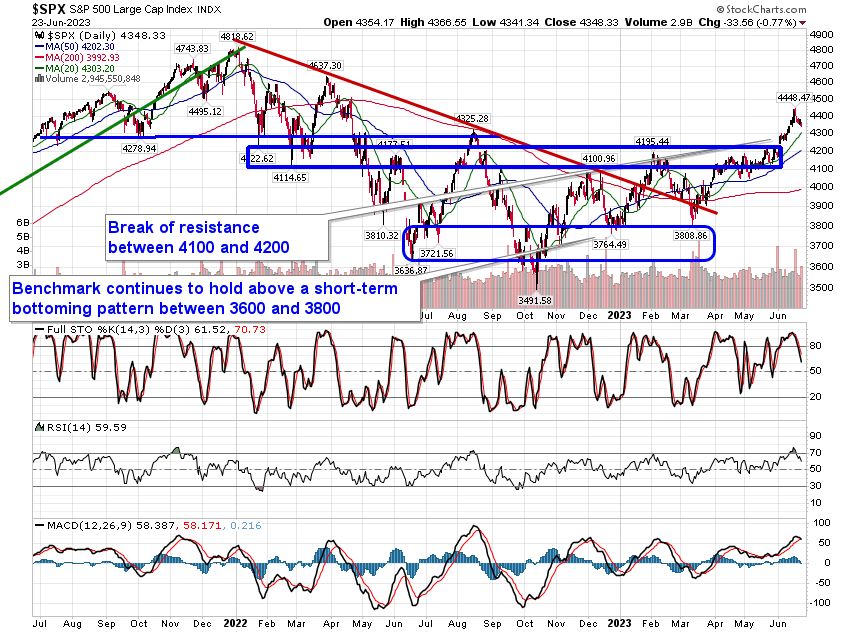
Stocks continued to slide on Friday as the mean reversion in the market ahead of the end of the quarter progresses. The S&P 500 Index shed just over three-quarters of one percent, inching closer to short-term support at the rising 20-day moving average around 4300. Intermediate support can be pegged at the 50-day moving average close to 4200. The benchmark continues to pullback from overbought territory and MACD remains on the verge of charting a bearish crossover of its signal line in what would amount to a new sell signal if achieved. The intermediate-term trend remains that of higher-highs and higher-lows and this is not expected to show an imminent change with the normal summer rally period that runs through the first few weeks of July, directly ahead.

This content is exclusive to subscribers of EquityClock.com. Please Log In or Subscribe to proceed.
Seasonal charts of companies reporting earnings today:

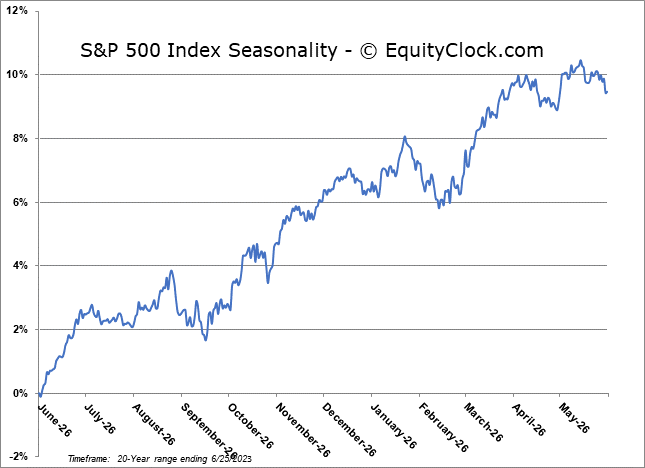
S&P 500 Index
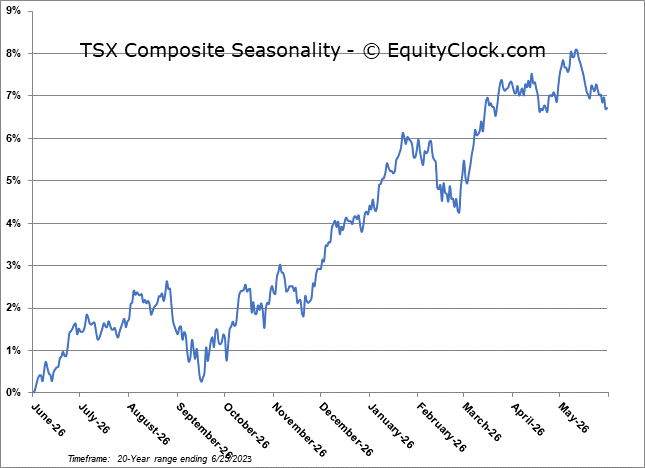
TSE Composite