The seasonal adjustment factor doesn’t appear to know what to do with the new Juneteenth holiday.
*** Stocks highlighted are for information purposes only and should not be considered as advice to purchase or to sell mentioned securities. As always, the use of technical and fundamental analysis is encouraged in order to fine tune entry and exit points to average seasonal trends.
Stocks Entering Period of Seasonal Strength Today:
Subscribers – Click on the relevant link to view the full profile. Not a subscriber? Signup here.


Super Simple Seasonal Portfolio
This content is exclusive to subscribers of EquityClock.com. Please Log In or Subscribe to proceed.
The Markets
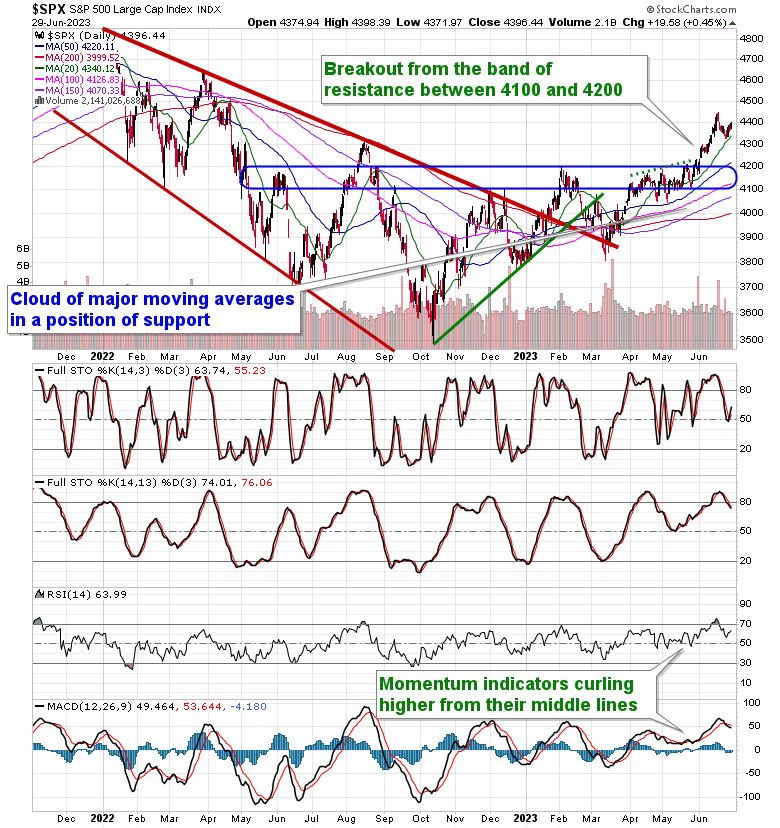
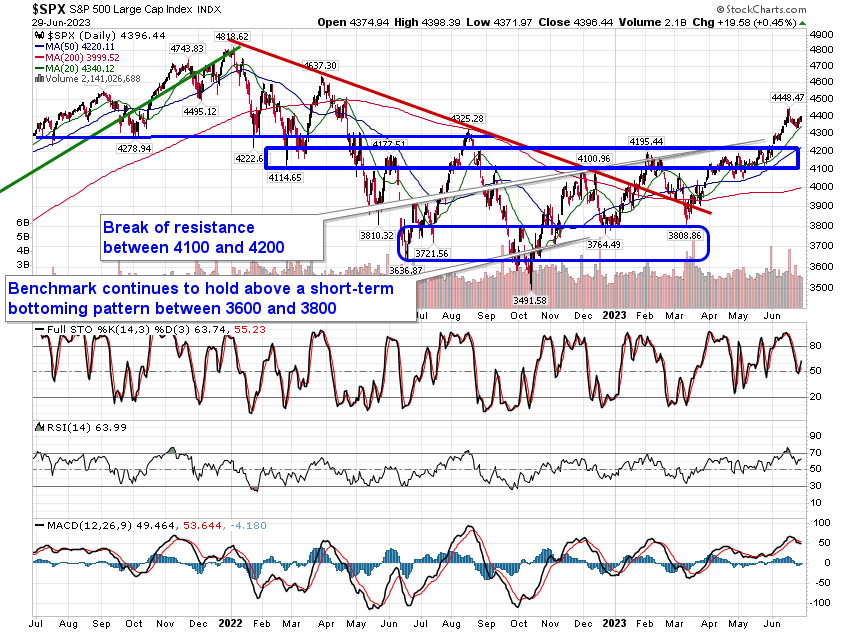
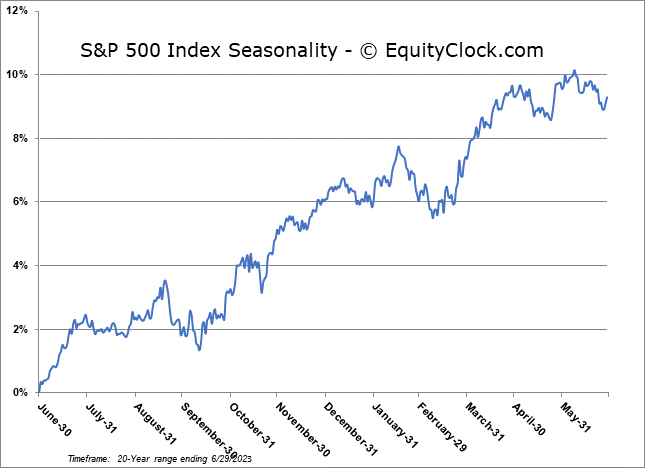
Stocks rose in the Thursday session as the normal summer rally period that spans from the end of June through the middle of July gets underway. The S&P 500 Index added just less than half of one percent, remaining supported around the rising 20-day moving average at 4340. Momentum indicators are sitting comfortably above their middle lines and are showing progress curling higher again following the alleviation of overbought conditions during the end-of quarter mean reversion period that came to an end on Monday. Between now and the 17th of July, on average, stocks are typically higher in what is one of the stronger timeframes for the year for the equity market. But, barring new life granted to the market from this upcoming earnings season, this strength typically gives way to volatility that spans the remainder of the third quarter, resulting in the weakest and riskiest time of the year to be invested in stocks. We break down everything that you need to know in our just released monthly report for July. Look for this report in your inbox or via the archive at https://charts.equityclock.com/.
Just released…
Our monthly report for July is out, providing you with everything that you need to know for the month(s) ahead.
Highlights in this report include:
- Equity market tendencies in the month of July
- Positioning/sentiment no longer a tailwind for stocks
- Trading the period of seasonal volatility ahead
- Gold
- The Summer Rally
- What scenario specific seasonal studies have to say
- Banks continue to have nothing optimistic to say of the market nor the economy
- Canadian Banks
- Treasury Yield spreads turning lower again after showing signs of starting to normalize in March
- Central bank liquidity supporting equity prices
- Analysts forecasting growth through the back half of the year
- Strong consumer offsetting weak business activity
- The burden against the consumer heading through the back half of the year
- Businesses/Producers potentially entering a deflationary phase
- Bond market hanging in and still looking good for when positive tendencies resume mid-July
- Opportunities outside of the US
- Looking for rotation into Emerging Markets
- Health care remains the correct prescription for summer portfolios
- Gauges of risk reacting to levels of horizontal resistance
- Our list of all segments of the market to either Accumulate or Avoid, along with relevant ETFs
- Positioning for the months ahead
- Sector Reviews and Ratings
- Stocks that have Frequently Gained in the Month of July
- Notable Stocks and ETFs Entering their Period of Strength in July
Look for this 106-page report in your inbox or via the archive at https://charts.equityclock.com/
This content is exclusive to subscribers of EquityClock.com. Please Log In or Subscribe to proceed.
Seasonal charts of companies reporting earnings today:


S&P 500 Index
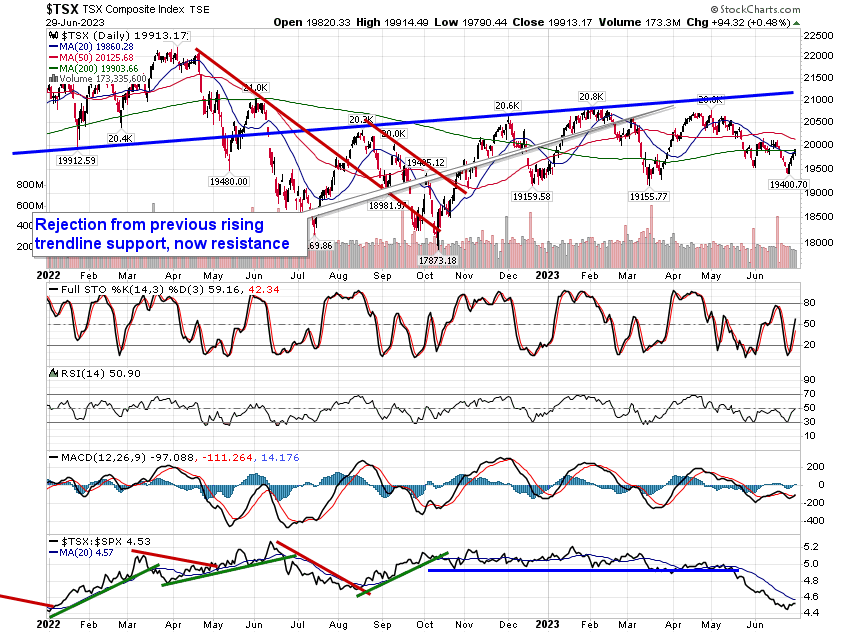
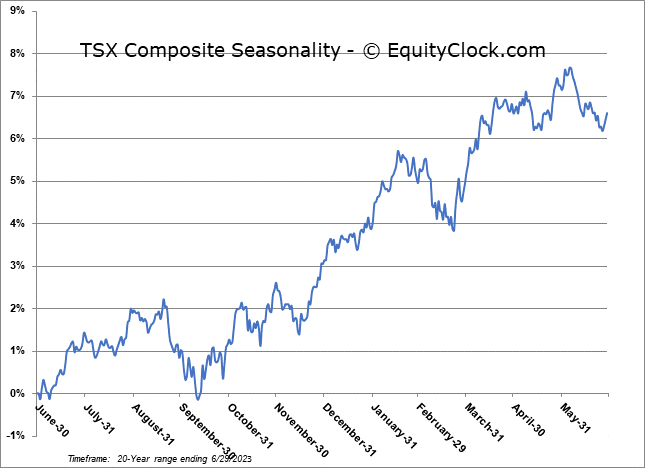
TSE Composite