REITs are finally moving beyond declining trendline resistance as the second period of strength for the sector gets underway.
*** Stocks highlighted are for information purposes only and should not be considered as advice to purchase or to sell mentioned securities. As always, the use of technical and fundamental analysis is encouraged in order to fine tune entry and exit points to average seasonal trends.
Stocks Entering Period of Seasonal Strength Today:
Subscribers – Click on the relevant link to view the full profile. Not a subscriber? Signup here.


Super Simple Seasonal Portfolio
This content is exclusive to subscribers of EquityClock.com. Please Log In or Subscribe to proceed.
The Markets
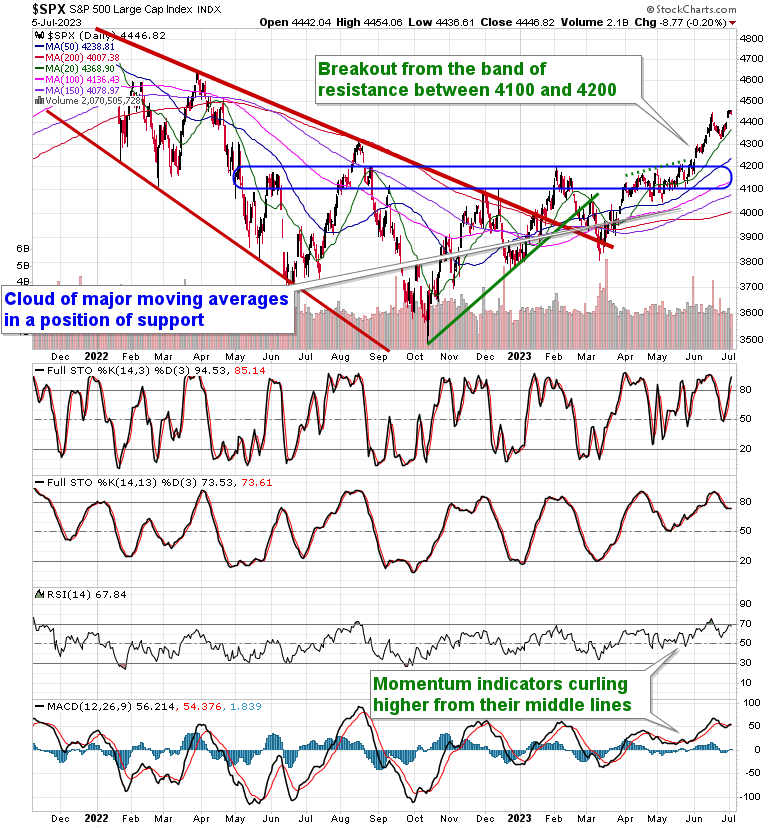
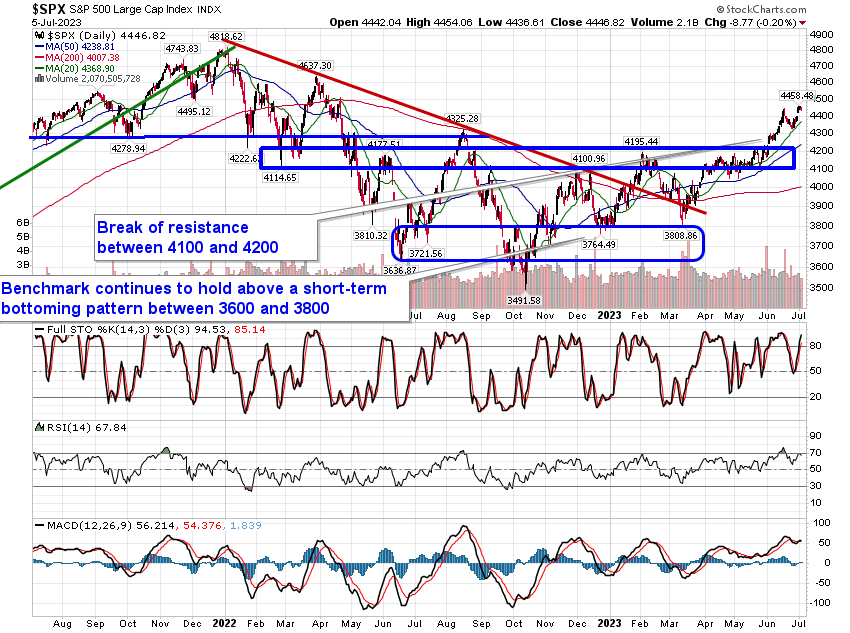
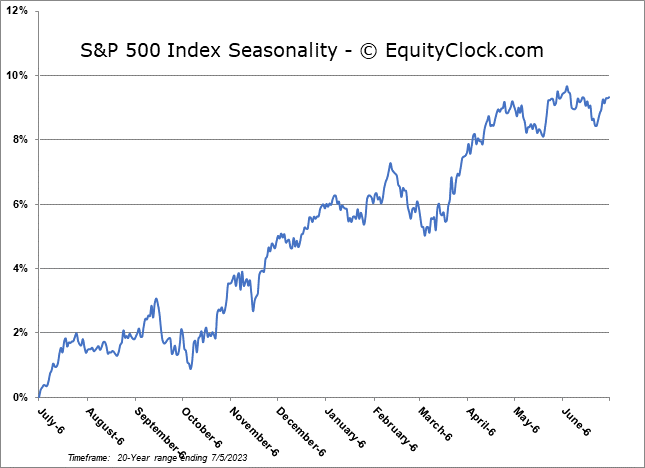
Stocks closed mixed on Wednesday as core-cyclicals struggled following a weaker than expected headline print of factory orders for May. The S&P 500 Index closed down by a mere two-tenths of one percent, continuing to hold above Friday’s upside open gap around 4400 and support at the rising 20-week moving average. Major moving averages continue to fan out, providing characteristic of a bullish trend and highlighting a number of points of reference below that may act as support should near-term volatility materialize. Momentum indicators are showing similar bullish traits above their middle lines. The only knock against the market, technically, at this point is that evidence of a short-term parabolic rise persists, which could make the benchmark vulnerable to a retracement towards major moving averages below, but seasonal tendencies through the middle of July suggest that stocks should remain resilient and the higher risk of decline is likely to be seen as the period of volatility in stocks ramps up in August and September. The breakout of the approximately 400-point span between 3800 and 4200 projects an upside target towards 4600, or just over 3% above present levels. The fundamental backdrop to the economy still presents plenty of reason for concern, but there are still areas to target within portfolios that check the three prong to our apporach. Our list of Accumulate candidates, according to our weekly chart books, is available to subscribers below.
This content is exclusive to subscribers of EquityClock.com. Please Log In or Subscribe to proceed.
Seasonal charts of companies reporting earnings today:


S&P 500 Index
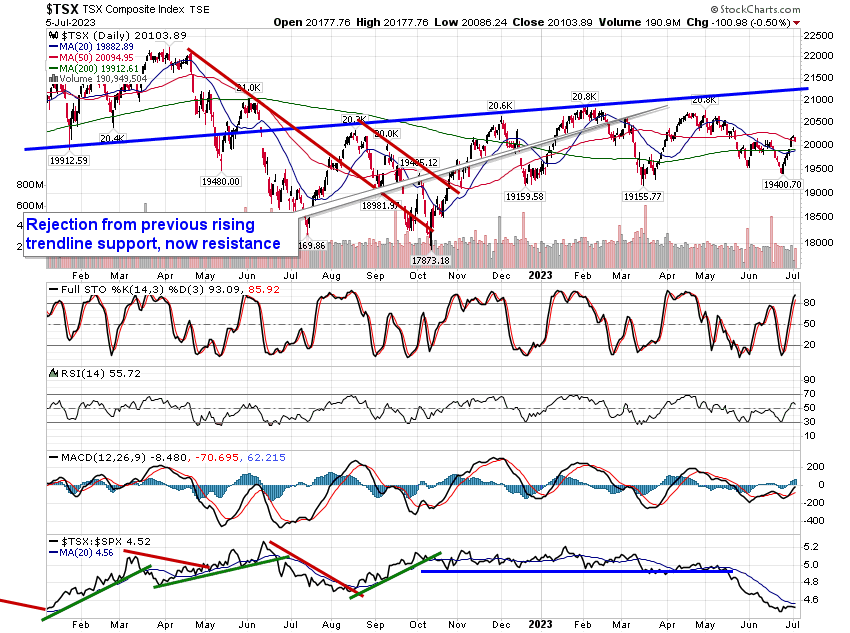
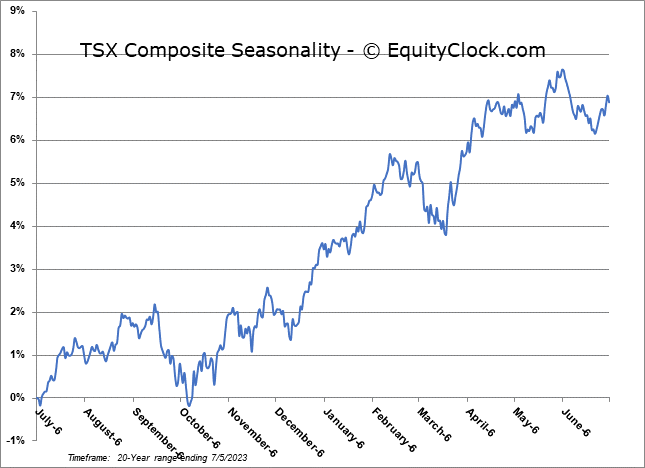
TSE Composite