A dramatic plunge in energy commodity demand last week highlights the disruption that has resulted from the Independence Day holiday closure.
*** Stocks highlighted are for information purposes only and should not be considered as advice to purchase or to sell mentioned securities. As always, the use of technical and fundamental analysis is encouraged in order to fine tune entry and exit points to average seasonal trends.
Stocks Entering Period of Seasonal Strength Today:
Subscribers – Click on the relevant link to view the full profile. Not a subscriber? Signup here.


Super Simple Seasonal Portfolio
This content is exclusive to subscribers of EquityClock.com. Please Log In or Subscribe to proceed.
The Markets
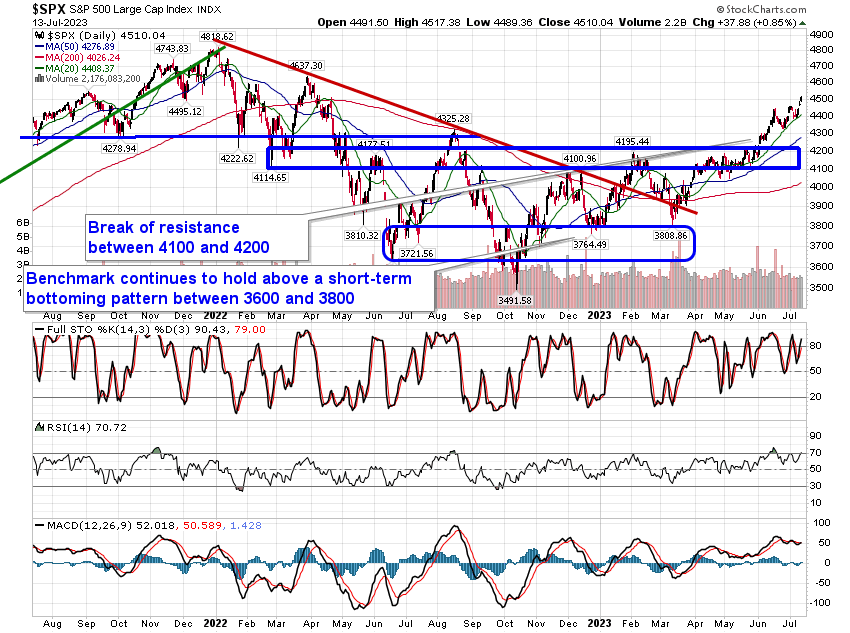
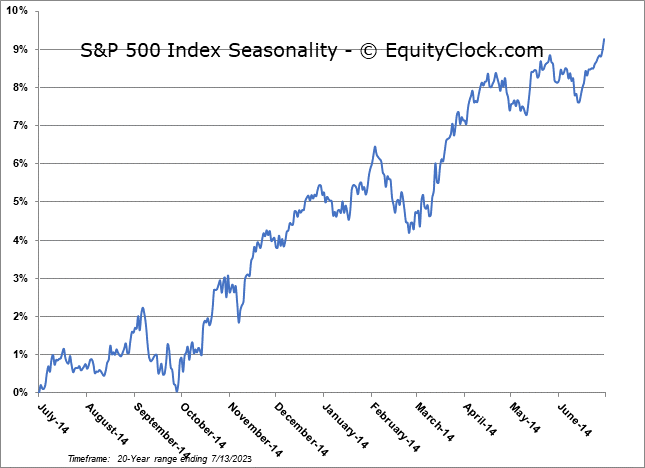
Stocks climbed again on Thursday as ongoing evidence of the alleviation of inflationary pressures allowed interest rates and the dollar to collapse, leading to strength in stocks. The S&P 500 Index closed with a gain of over eight-tenths of one percent, edging past psychological resistance at 4500. Next stop following this break of short-term psychological resistance is to the target that we have proposed previously at 4600, based on the calculated projection from the breakout of the 400-point range between 3800 and 4200. Support remains solid around the 20-day moving average at 4408. The advance has placed the Relative Strength Index (RSI) back above 70, classifying an overbought condition that risks exhausting buying pressures in the near-term. For now, signs of this buying exhaustion remain absent and the path for prices, both on a short and intermediate-term basis, remains positive, supported by rising moving averages. Seasonally, the average peak to the summer rally period is on July 17th (Monday), but strength encompassing the entire month of July is the norm as prices run higher into the start of earnings season.

This content is exclusive to subscribers of EquityClock.com. Please Log In or Subscribe to proceed.
Seasonal charts of companies reporting earnings today:


S&P 500 Index
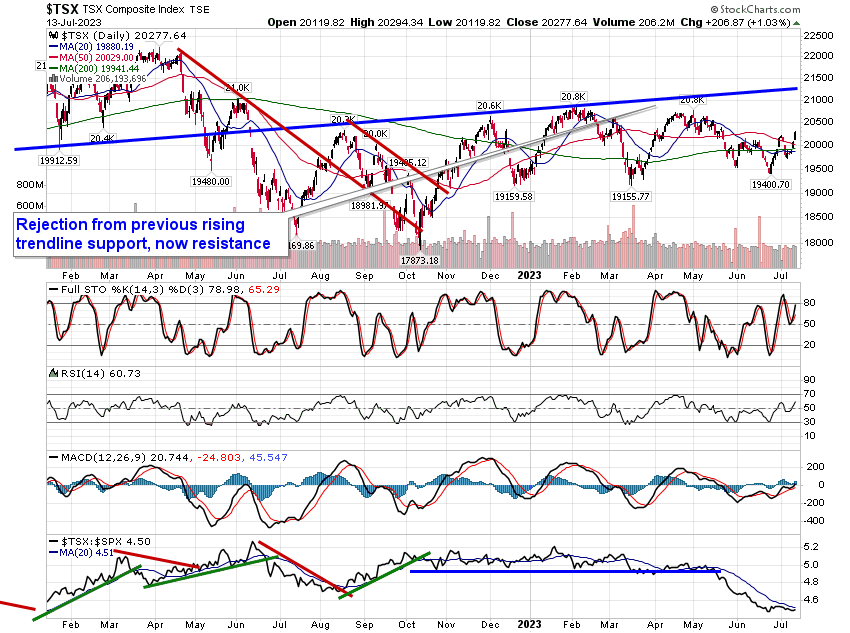
TSE Composite