Shipping expenditures have fallen by the most on record through the first half of the year, a testament to the slowing business and consumer economies.
*** Stocks highlighted are for information purposes only and should not be considered as advice to purchase or to sell mentioned securities. As always, the use of technical and fundamental analysis is encouraged in order to fine tune entry and exit points to average seasonal trends.
Stocks Entering Period of Seasonal Strength Today:
Subscribers – Click on the relevant link to view the full profile. Not a subscriber? Signup here.


Super Simple Seasonal Portfolio
This content is exclusive to subscribers of EquityClock.com. Please Log In or Subscribe to proceed.
The Markets
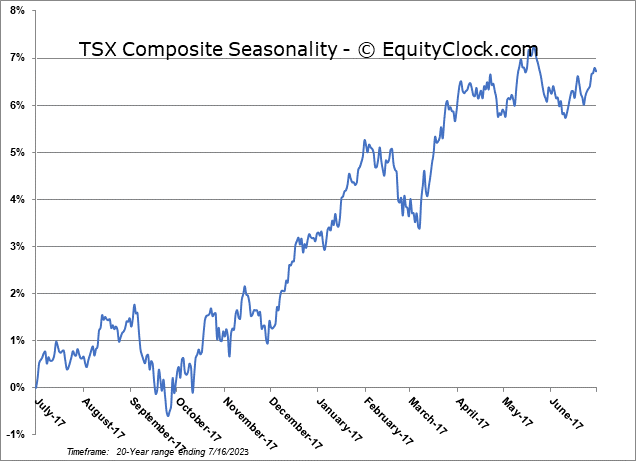
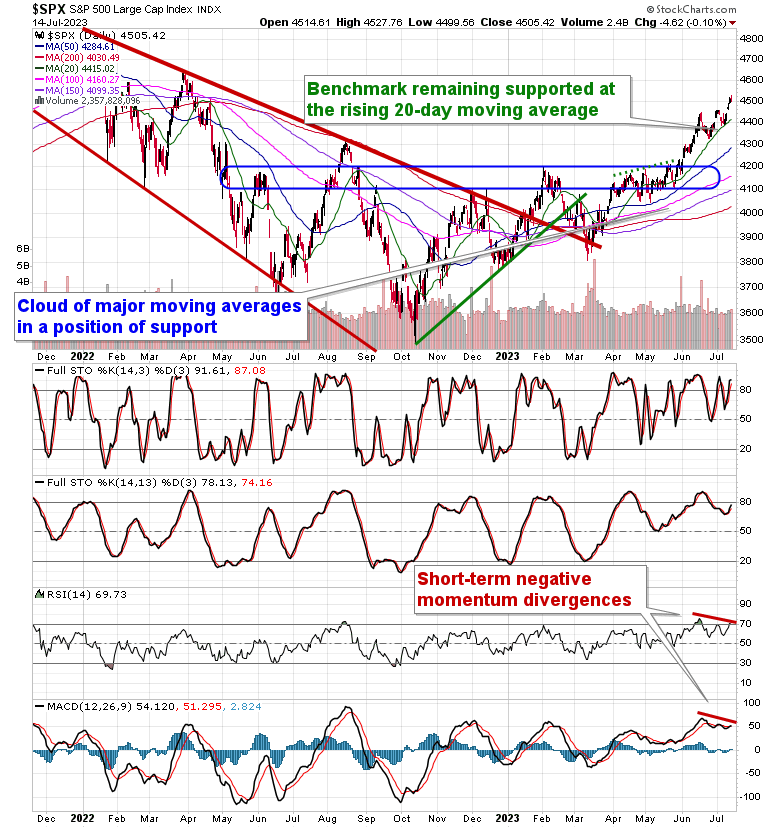
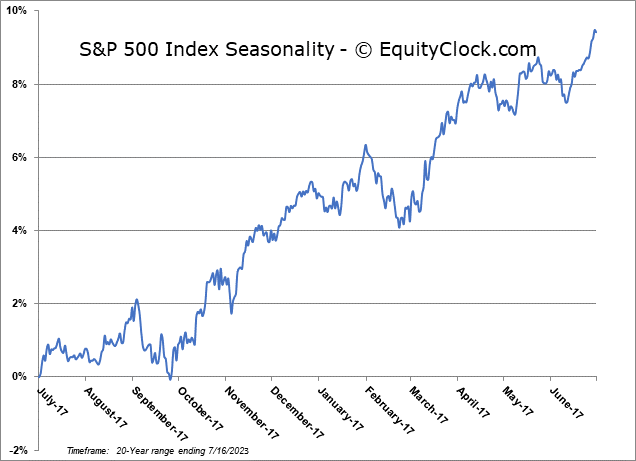
Stocks closed marginally lower on Friday as early hints that the summer rally period may be starting to lose steam emerges as we approach the average peak on the 17th of July. The S&P 500 Index closed down by one-tenth of one percent, realizing a reversal session as early day strength had traders booking profits. Support remains firm at the rising 20-day moving average, now at 4415, and the fanning out of major moving averages continues to present a bullish viewpoint from an intermediate-term perspective given the number of levels of support that are presented below. The Relative Strength Index (RSI) continues to border on overbought territory. While this stretched state could exhaust buying demand in the short-term, the overbought condition is yet another trait of a market that is within a bullish trend. The struggling state of the macro-economic fundamentals leaves us less inclined to chase overbought extremes and, rather, wait for pullbacks towards levels of support in order to pursue seasonal and technical trades as part of the summer rally and other third quarter buying patterns. Seasonally, strength in the broader market can persist throughout the entire month of July, but the strongest of the mid-year rally reaches a peak on the July 17th, on average. Investors must be prepared to book profits in seasonal summer rally trades through the remainder of the month given the elevated probability of a pullback through August and September, as per seasonal norms.
This content is exclusive to subscribers of EquityClock.com. Please Log In or Subscribe to proceed.
Sectors and Industries entering their period of seasonal strength:


Analysis of the Recreational Services Industry seasonal charts above shows that a Buy Date of July 16 and a Sell Date of October 24 has resulted in a geometric average return of 2.45% above the benchmark rate of the S&P 500 Total Return Index over the past 18 years. This seasonal timeframe has shown positive results compared to the benchmark in 14 of those periods. This is a good rate of success and the return strongly outperforms the relative buy-and-hold performance of the stock over the past 18 years by an average of 13.14% per year.
Seasonal charts of companies reporting earnings today:


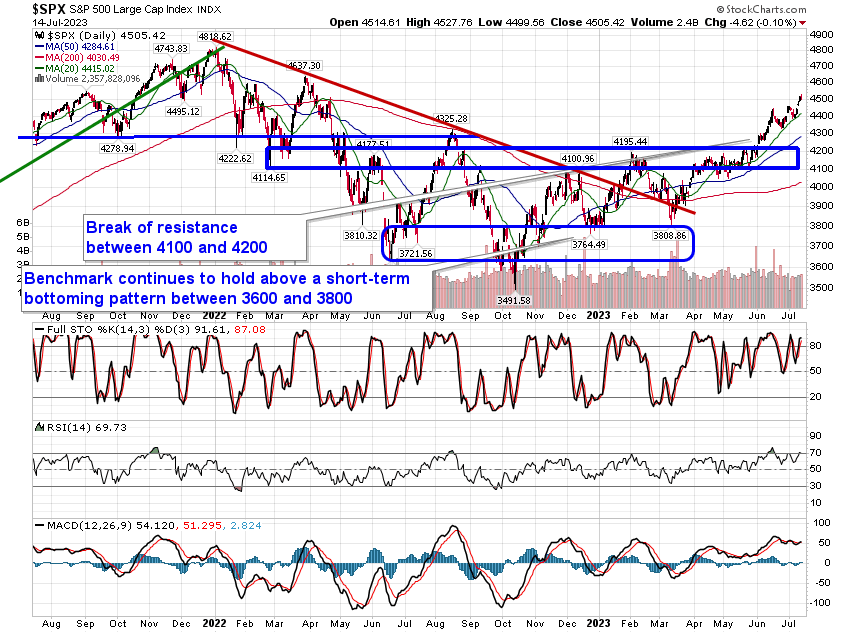
S&P 500 Index
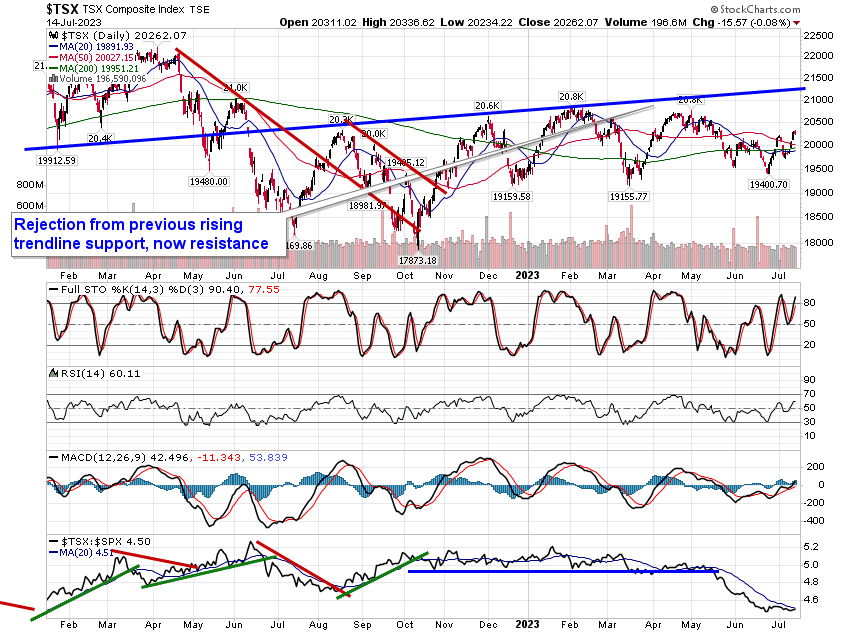
TSE Composite