You're receiving this daily market outlook because you are subscribed to Equity Clock. Want to opt-out and only receive the monthly and intraday reports? Simply reply to this email to let us know.
Having trouble viewing this email? View in your browser.
Equity Clock - Market Outlook for July 18, 2023
The below average trend of manufacturer sentiment readings continues into July, suggesting weaker than normal activity at this time of year that typically sees factories shutdown/re-tool.
*** Stocks highlighted are for information purposes only and should not be considered as advice to purchase or to sell mentioned securities. As always, the use of technical and fundamental analysis is encouraged in order to fine tune entry and exit points to average seasonal trends.
Stocks Entering Period of Seasonal Strength Today:
Subscribers – Click on the relevant link to view the full profile. Not a subscriber? Signup here.
This content is exclusive to subscribers of EquityClock.com. Please Log In or Subscribe to proceed.
The Markets
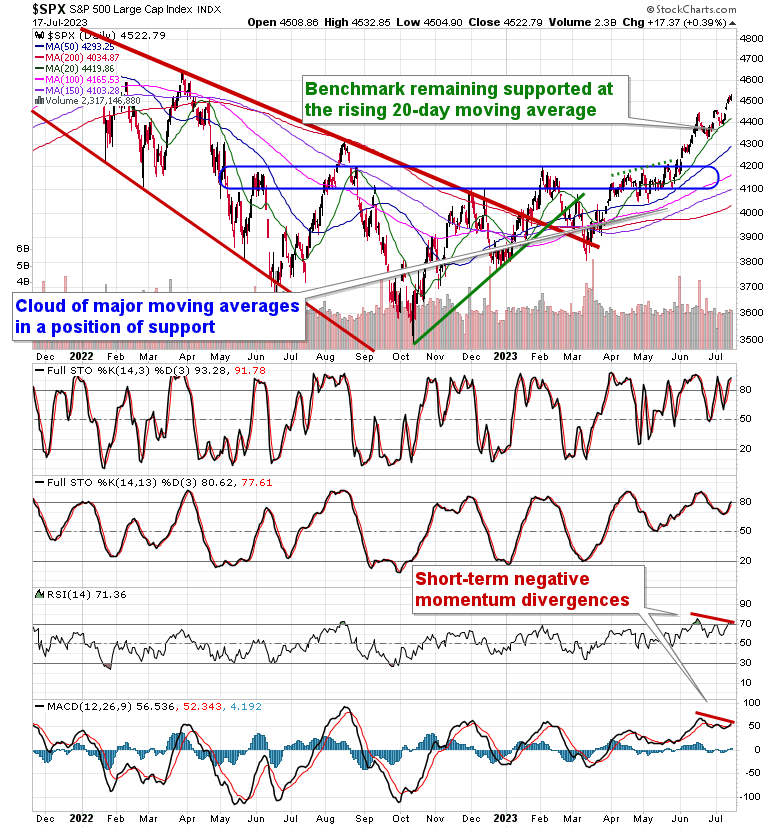
Stocks closed with gains on the day that traditionally marks the average peak to the summer rally timeframe that began in the last week of June. The S&P 500 Index closed higher by just less than four-tenths of one percent, charting a fresh 52-week high. The Relative Strength Index (RSI) has moved back into overbought territory following this mid-year gyration, threatening to exhaust buying demand in the short-term, particularly now that the strongest period of July has concluded. Momentum indicators continue to show characteristics of a bullish trend above their middle lines and moving averages continue to fan out in a bullish manner.
This content is exclusive to subscribers of EquityClock.com. Please Log In or Subscribe to proceed.
Seasonal charts of companies reporting earnings today:
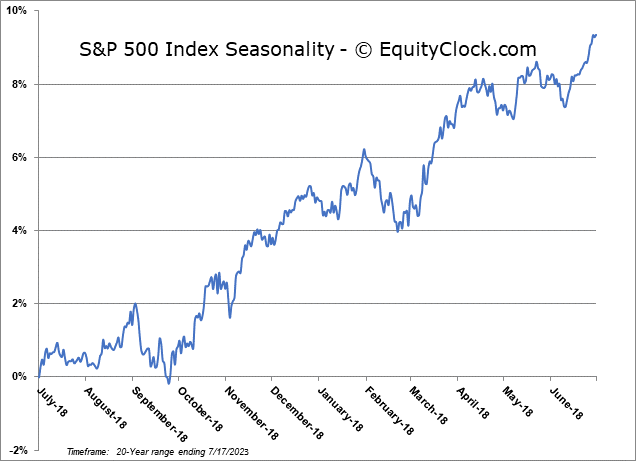
S&P 500 Index
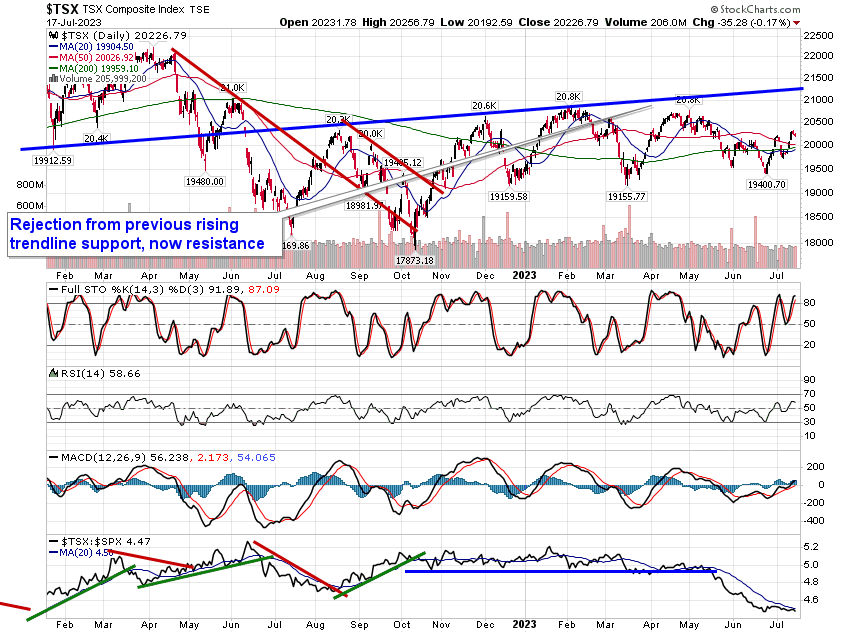
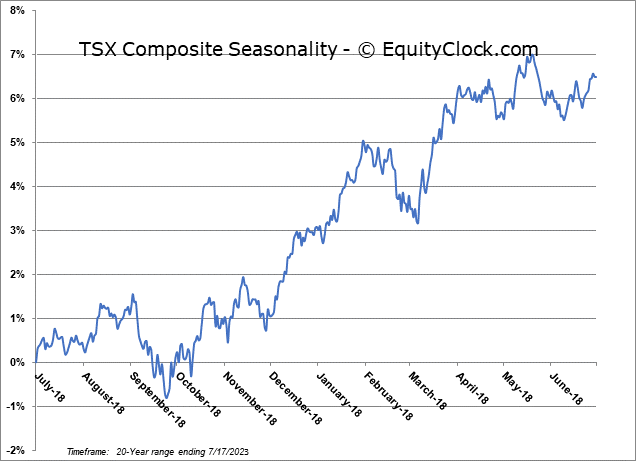
TSE Composite
If you wish to be excluded from this distribution, simply reply to this email requesting to have your email removed from our list or click on the following link: **Note: You will continue to have access to our reports so long as your subscription at Equity Clock remains active. To manage your subscription to our service, please visit the Members Section at https://charts.equityclock.com/members.


 Seasonal Chart")