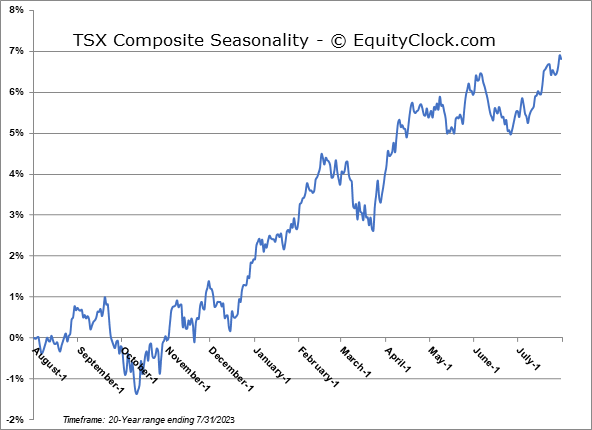
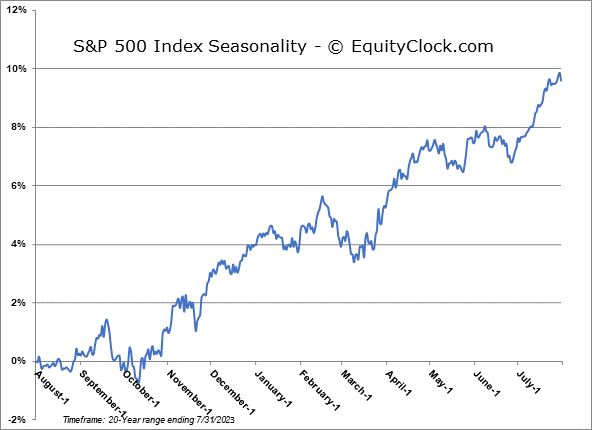
Over the past 20 years, the S&P 500 Index has gained 0.1%, on average, and 60% of periods have produced a positive result.
*** Stocks highlighted are for information purposes only and should not be considered as advice to purchase or to sell mentioned securities. As always, the use of technical and fundamental analysis is encouraged in order to fine tune entry and exit points to average seasonal trends.
Stocks Entering Period of Seasonal Strength Today:
Subscribers – Click on the relevant link to view the full profile. Not a subscriber? Signup here.


Super Simple Seasonal Portfolio
This content is exclusive to subscribers of EquityClock.com. Please Log In or Subscribe to proceed.
The Markets
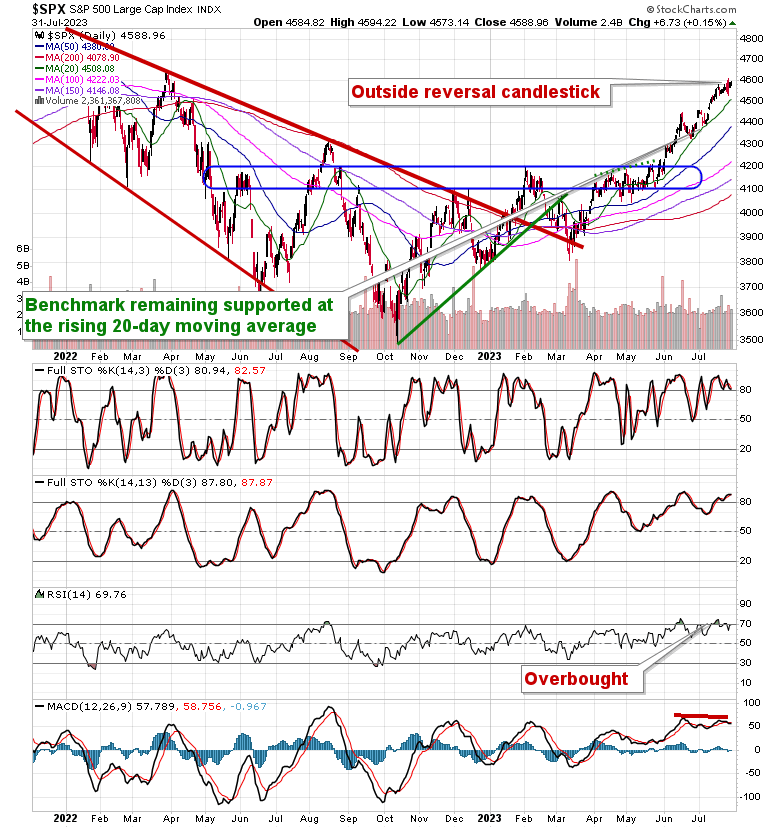
Stocks closed marginally higher on Monday as investors squared away positions ahead of the end of July. The S&P 500 Index squeezed out a gain of just over one-tenth of one percent in the final minutes of the session in typical window dressing fashion. Price continues to hover in the range of Thursday’s bearish engulfing candlestick, which highlighted hesitation among investors to buy around our proposed summer rally target of 4600. The divergence with respect to MACD attests to the same waning upside momentum at these heights. Support remains persistent at the rising 20-day moving average, now at 4508, and moving averages continue to fan out in a bullish manner, providing many points of reference below to catch the market should volatility in fact materialize as per seasonal norms in August and September. As profiled in the real-time seasonal charts at the bottom of this report for the S&P 500 Index and the TSX Composite, the trend of the equity market into the month of October is nothing to be enticed by to be aggressive in stocks and caution is typically the order of the day, particularly if there are no catalysts behind stocks to drive prices higher.
This content is exclusive to subscribers of EquityClock.com. Please Log In or Subscribe to proceed.
Seasonal charts of companies reporting earnings today:


 Seasonal Chart")


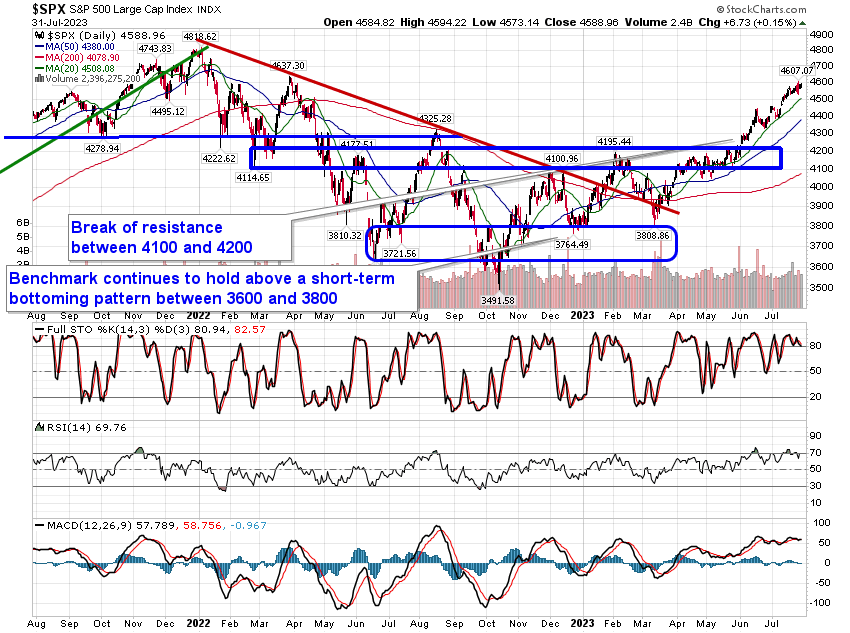
S&P 500 Index
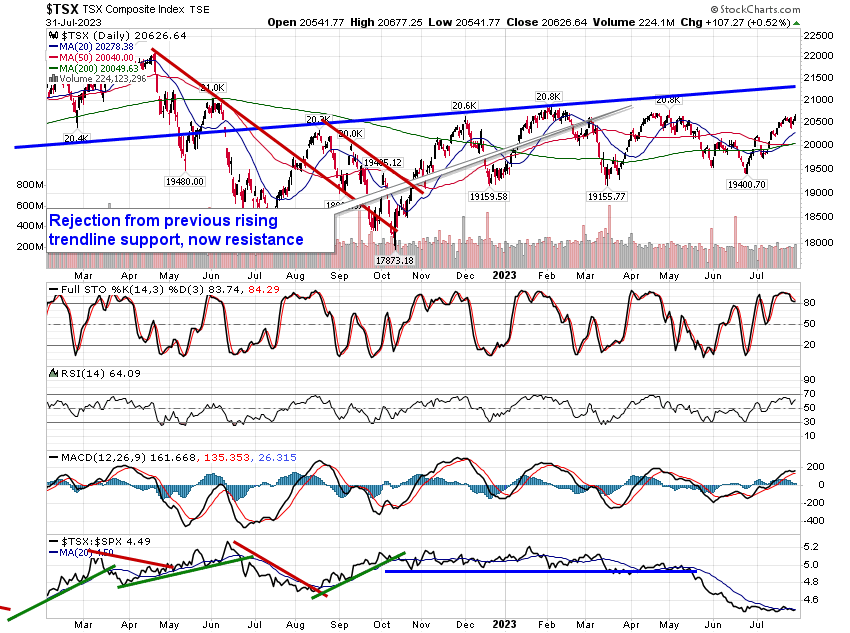
TSE Composite