The fact that July’s CPI report completely ignored the 7.2% rise in gasoline prices since the end of June suggests that the aggregate print was a vast under-estimate of the rate of inflation in the economy.
*** Stocks highlighted are for information purposes only and should not be considered as advice to purchase or to sell mentioned securities. As always, the use of technical and fundamental analysis is encouraged in order to fine tune entry and exit points to average seasonal trends.
Stocks Entering Period of Seasonal Strength Today:
Subscribers Click on the relevant link to view the full profile. Not a subscriber? Signup here.


Super Simple Seasonal Portfolio
This content is exclusive to subscribers of EquityClock.com. Please Log In or Subscribe to proceed.
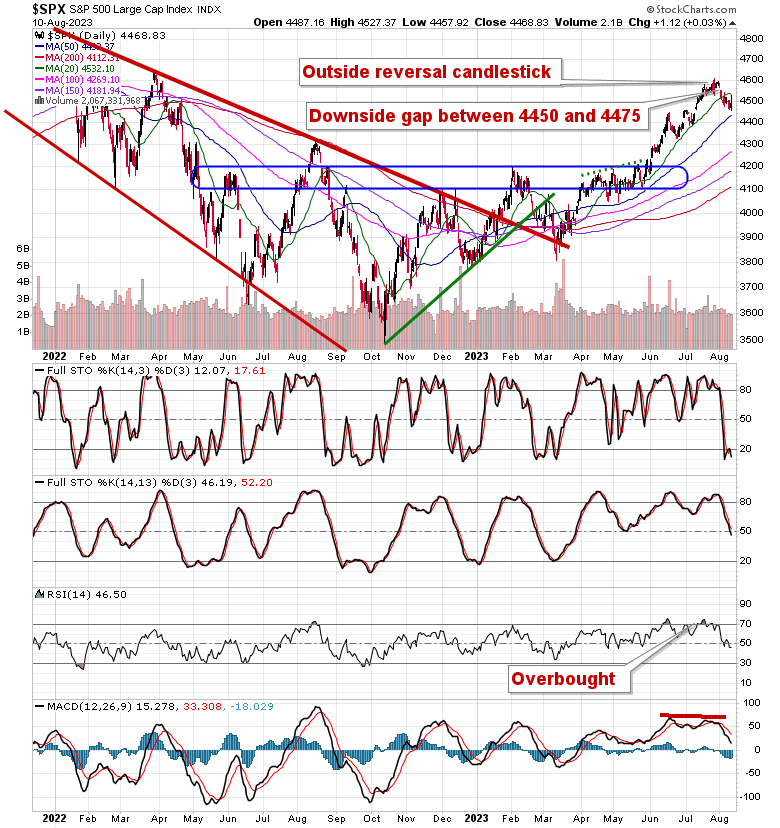
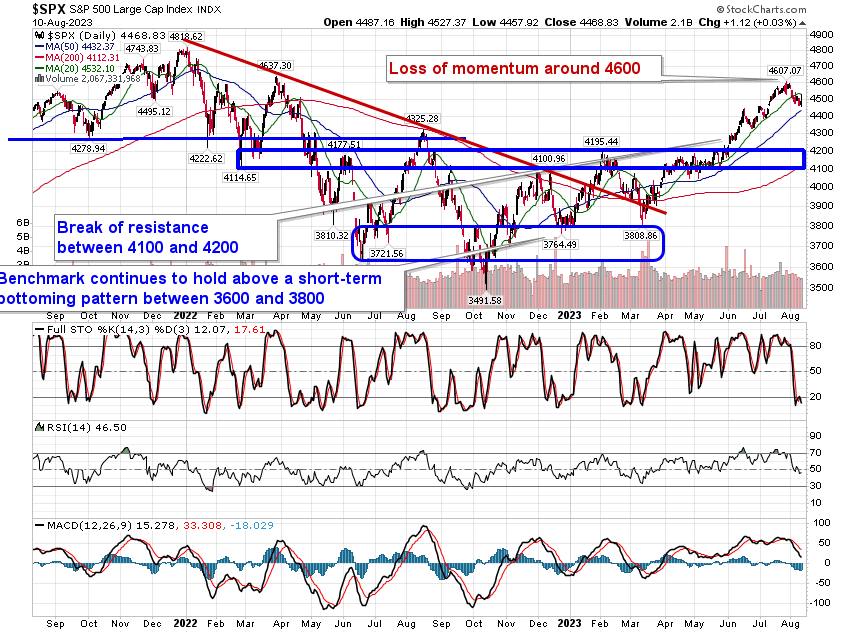
The Markets
Stocks closed near the flat-line on Thursday, giving up all the strong gains that had been achieved earlier in the session as investors remain in this phase of taking advantage of strength to sell rather than to buy. The S&P 500 Index closed higher by a mere three-basis points (0.03%) after testing previous support, now resistance, at the 20-day moving average. The variable hurdle is now pointing lower, defining a declining path over a short-term timeframe. The benchmark still appears intent to test intermediate support around its 50-day moving average, now at 4432, although, levels down to the June breakout point of 4200 are fair game as part of this period of normal volatility/weakness that spans the months of August and September. Momentum indicators on the daily chart are still pointed lower, not providing any indication, yet, that stocks are set to resume their rising path anytime soon.
This content is exclusive to subscribers of EquityClock.com. Please Log In or Subscribe to proceed.
Seasonal charts of companies reporting earnings today:


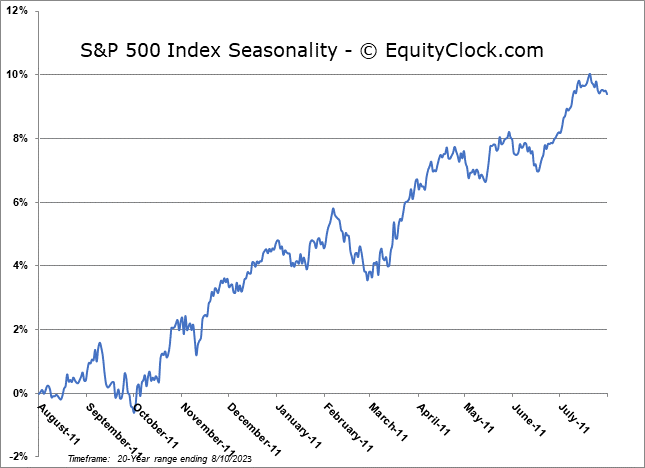
S&P 500 Index
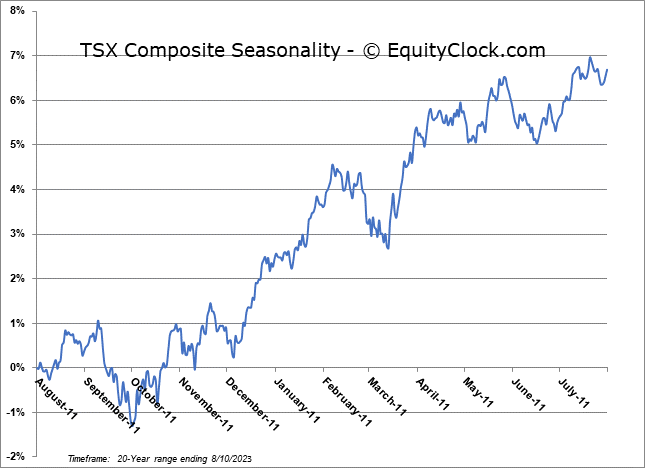
TSE Composite