Treasury yield spreads are showing indications that they have bottomed and the path towards normalization may be underway.
*** Stocks highlighted are for information purposes only and should not be considered as advice to purchase or to sell mentioned securities. As always, the use of technical and fundamental analysis is encouraged in order to fine tune entry and exit points to average seasonal trends.
Stocks Entering Period of Seasonal Strength Today:
Subscribers Click on the relevant link to view the full profile. Not a subscriber? Signup here.


Super Simple Seasonal Portfolio
This content is exclusive to subscribers of EquityClock.com. Please Log In or Subscribe to proceed.
The Markets
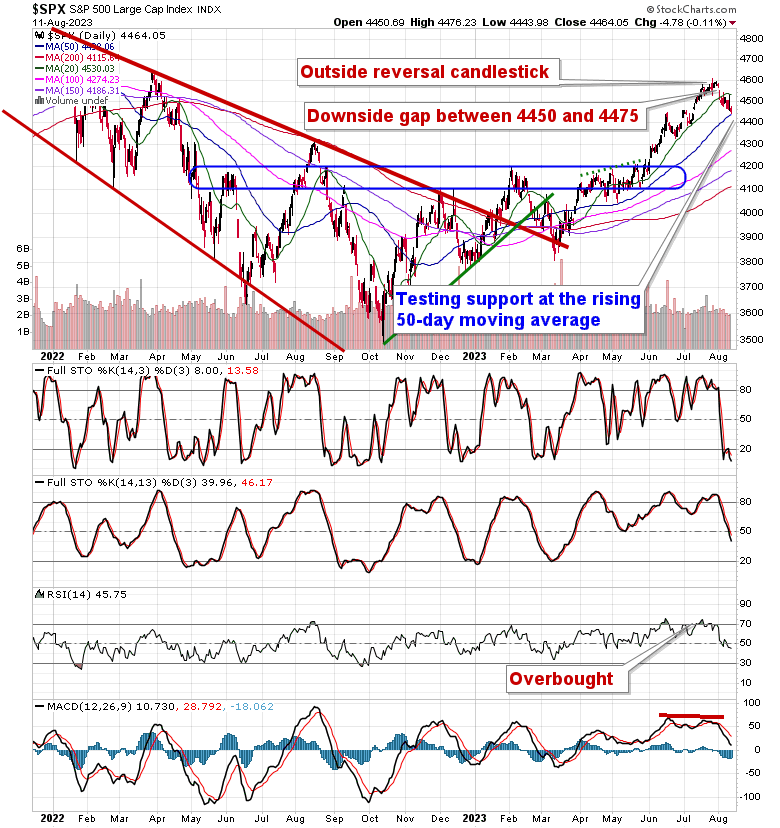
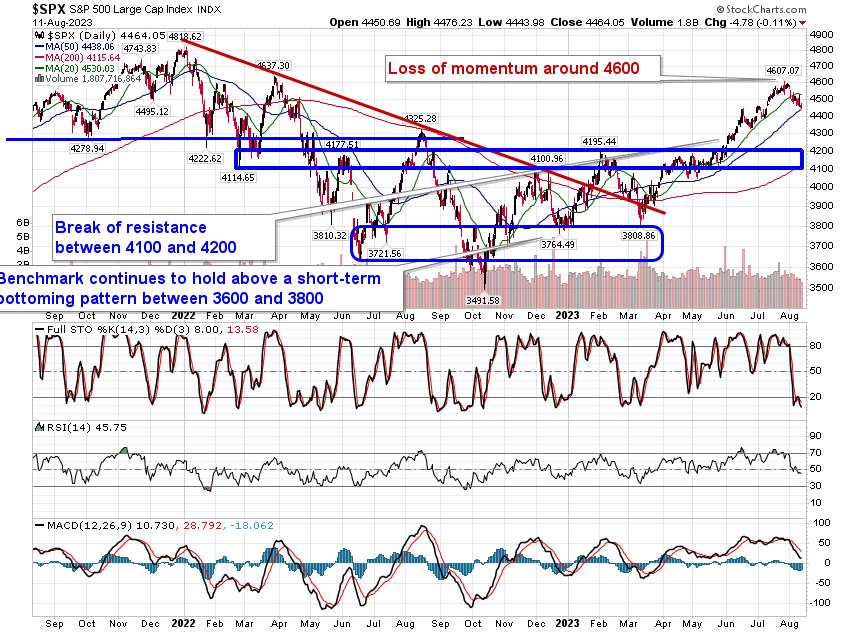
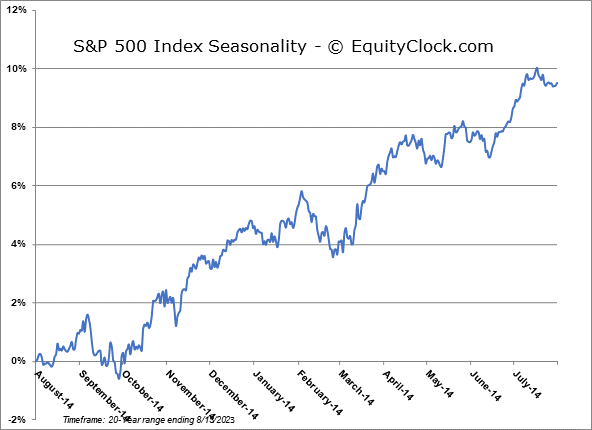
Stocks closed around the flat-line for a second day on Friday as ongoing weakness in the formerly beloved technology sector was offset by continued strength in energy and core-defensives (staples, health care, utilities, and REITs). The S&P 500 Index closed with a loss of just over a tenth of one percent, finding support around the 50-day moving average that was tested around the lows of the session. Resistance has been defined at the now declining 20-day moving average, providing a hurdle to shoot sell orders off of as part of this normal period of volatility/weakness that spans the months of August and September. Remember, levels down to the June breakout point at 4200 are fair game as part of this period of seasonal weakness, allowing the positive intermediate path to remain intact and potentially providing another buying opportunity for the best six months of the year for stocks that starts in October.
This content is exclusive to subscribers of EquityClock.com. Please Log In or Subscribe to proceed.
Seasonal charts of companies reporting earnings today:


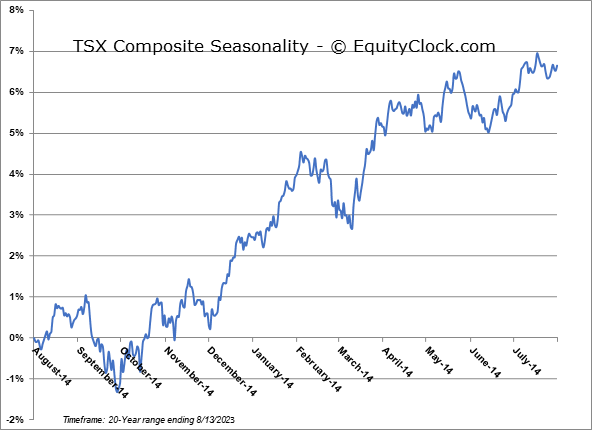
S&P 500 Index
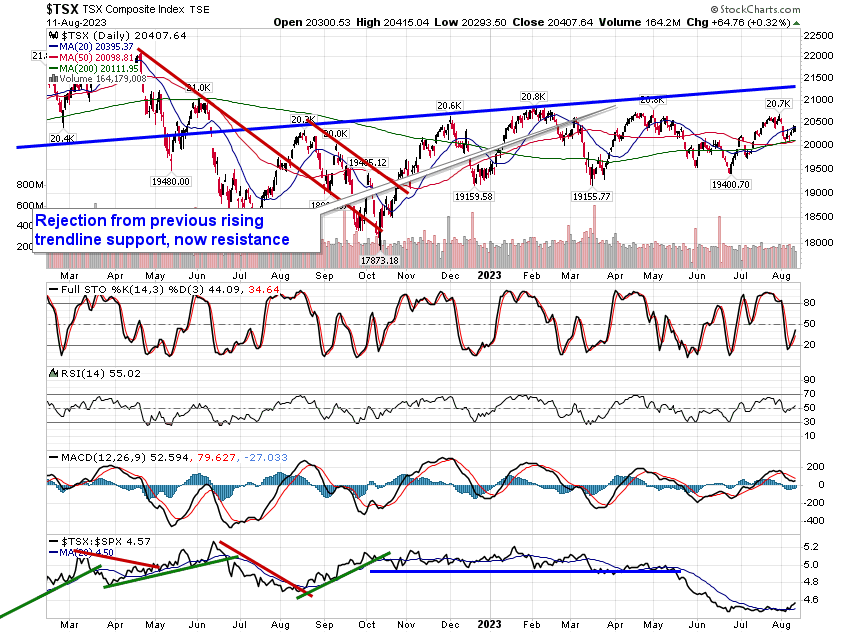
TSE Composite