You're receiving this daily market outlook because you are subscribed to Equity Clock. Want to opt-out and only receive the monthly and intraday reports? Simply reply to this email to let us know.
Having trouble viewing this email? View in your browser.
Equity Clock - Market Outlook for August 24, 2023
Gauges of consumer health continue to show a concerning path as we near the end of summer.
*** Stocks highlighted are for information purposes only and should not be considered as advice to purchase or to sell mentioned securities. As always, the use of technical and fundamental analysis is encouraged in order to fine tune entry and exit points to average seasonal trends.
Stocks Entering Period of Seasonal Strength Today:
Subscribers Click on the relevant link to view the full profile. Not a subscriber? Signup here.
This content is exclusive to subscribers of EquityClock.com. Please Log In or Subscribe to proceed.
The Markets
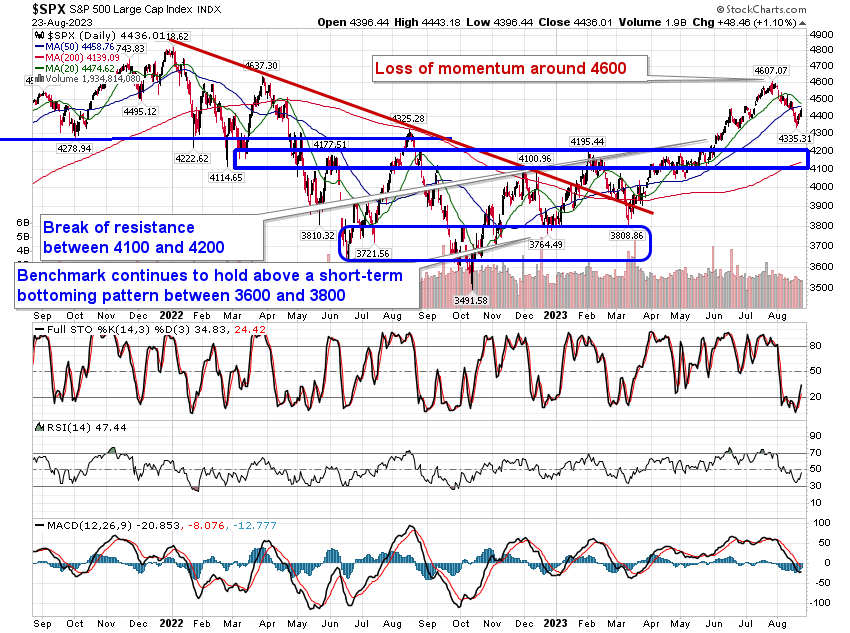
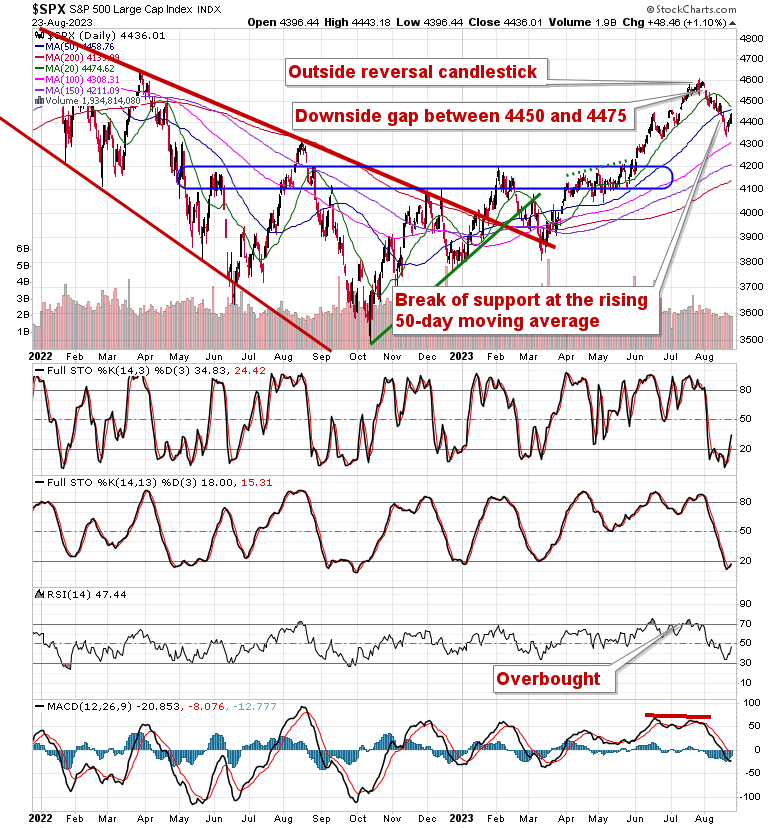
Stocks jumped on Wednesday as yields plunged, expressing the type of normal positivitythat surrounds the period heading into the Labor day holiday. The S&P 500 Index closed with a gain of 1.10%, increasingly reaching back to near-term levels of resistance around the 20 and 50-day moving averages that had been broken in the past few weeks. Momentum indicators on the large-cap benchmark continue to curl higher with Stochastics emerging from oversold territory charted at the start of the week. Volumes in the market continue to dwindle, making easy lifting for the few buyers to elevate prices off of their recent lows. At 1.934 trillion, the consolidated volume on the S&P 500 Index is around 16% below the 50-day average and one of the lowest volume days outside of a holiday period in the past year. This is very normal for this time of year heading towards the last long weekend of summer, but it is when the volumes return in September that the selling pressures that are normal for August and September, overall, resume.
This content is exclusive to subscribers of EquityClock.com. Please Log In or Subscribe to proceed.
Seasonal charts of companies reporting earnings today:
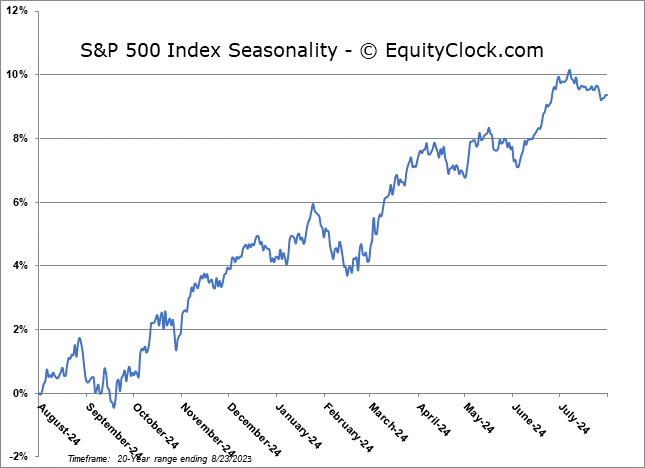
S&P 500 Index
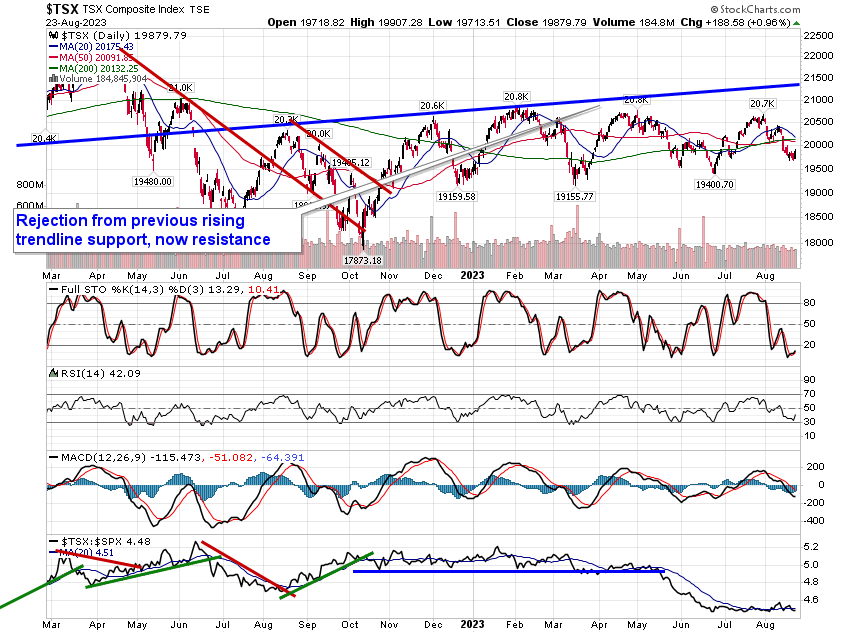
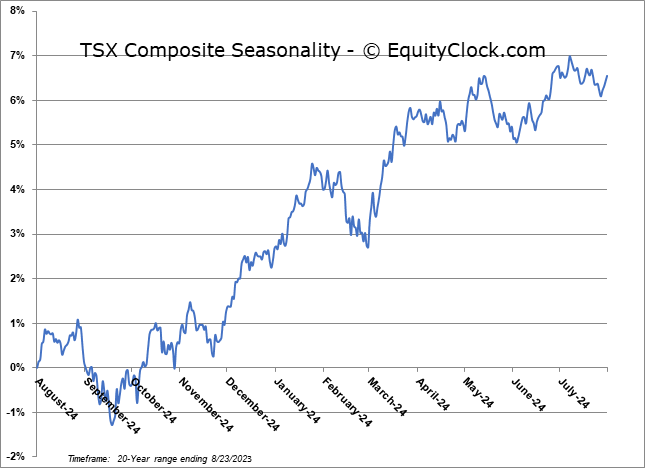
TSE Composite
If you wish to be excluded from this distribution, simply reply to this email requesting to have your email removed from our list or click on the following link: **Note: You will continue to have access to our reports so long as your subscription at Equity Clock remains active. To manage your subscription to our service, please visit the Members Section at https://charts.equityclock.com/members.


 Seasonal Chart")


 Seasonal Chart")