While bonds may not be providing the volatility hedge that we are accustomed to through the period of normal volatility for stocks, precious metals are starting to show their volatility benefit.
*** Stocks highlighted are for information purposes only and should not be considered as advice to purchase or to sell mentioned securities. As always, the use of technical and fundamental analysis is encouraged in order to fine tune entry and exit points to average seasonal trends.
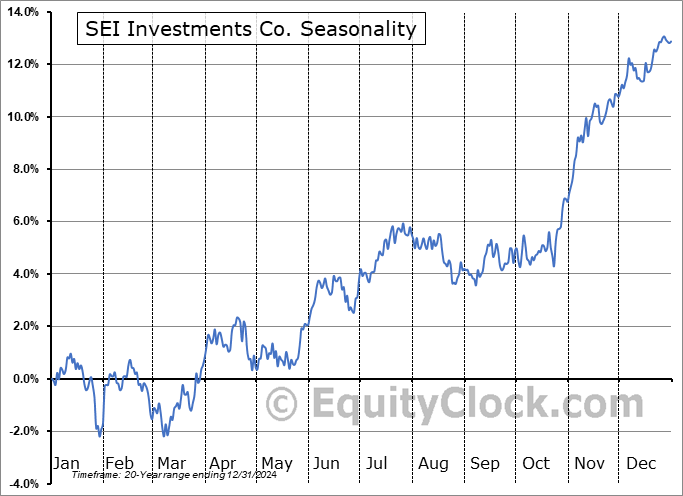
Stocks Entering Period of Seasonal Strength Today:
Subscribers Click on the relevant link to view the full profile. Not a subscriber? Signup here.


Super Simple Seasonal Portfolio
This content is exclusive to subscribers of EquityClock.com. Please Log In or Subscribe to proceed.
The Markets
Stocks dropped on Thursday as a jump in the cost of borrowing and concerns over the impact of a government shutdown had investors trimming risk from portfolios. The S&P 500 Index closed down by 1.64%, realizing the largest single session percentage decline since March, amidst the banking crisis. The benchmark has cracked below short-term support presented by the August low at 4335, a level that could be argued as representing the neckline to a head-and-shoulders topping pattern. Theory suggest that the downside target of the setup projects a move to levels just below 4100, however, previous significant horizontal resistance, now implied support at 4200 is bound to put up a big fight. A move below 4200, now also aligning with the rising 200-day moving average, would bring upon a whole new set of technical challenges that we can address should the market get to that point. Momentum indicators continue to roll over below their middle lines with MACD remaining on a sell signal. Characteristics of a bearish trend are increasingly apparent, which, combined with the negative seasonal backdrop for the last half of September, is not the type of environment to be aggressive in risk (stocks).

This content is exclusive to subscribers of EquityClock.com. Please Log In or Subscribe to proceed.
Seasonal charts of companies reporting earnings today:

S&P 500 Index


TSE Composite


