You're receiving this daily market outlook because you are subscribed to Equity Clock. Want to opt-out and only receive the monthly and intraday reports? Simply reply to this email to let us know.
Having trouble viewing this email? View in your browser.
Equity Clock - Market Outlook for November 3, 2023
The S&P 500 Index has retraced its recent losses to reach back to the upper limit of its short-term declining trend channel.
*** Stocks highlighted are for information purposes only and should not be considered as advice to purchase or to sell mentioned securities. As always, the use of technical and fundamental analysis is encouraged in order to fine tune entry and exit points to average seasonal trends.
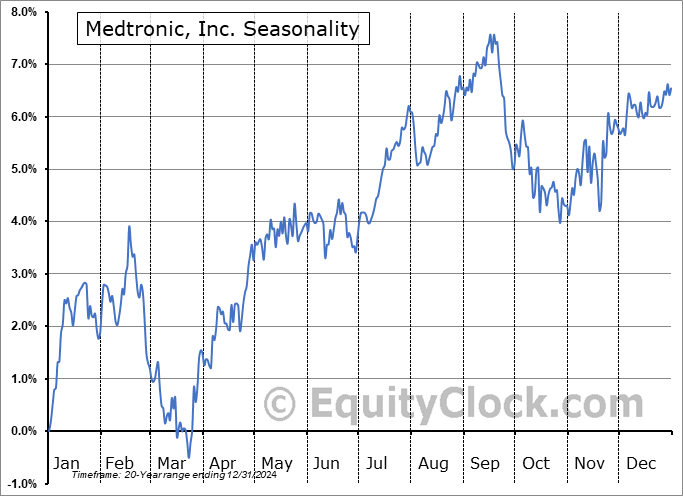
Stocks Entering Period of Seasonal Strength Today:
Subscribers Click on the relevant link to view the full profile. Not a subscriber? Signup here.
This content is exclusive to subscribers of EquityClock.com. Please Log In or Subscribe to proceed.
The Markets
Stocks rallied for a fourth straight session on Thursday as a plunge in the cost of borrowing had investors taking on risk. The S&P 500 Index added 1.89%, gaping back above its 20 and 200-day moving averages to close back in on recent defined resistance at the 50-day moving average (~4350). The intermediate moving average coincides with the upper limit of the declining trend channel that the benchmark has been in since July, presenting another hurdle where digestion of recent strength may be realized. The benchmark remains resilient above the horizontal band of support between 4100 and 4200, providing the ideal risk-reward to accumulating risk (stocks), so long as price remains above. MACD has charted a new buy signal by crossing above its signal line and the Relative Strength Index (RSI) has inched above its middle line. These momentum indicators had been suggesting waning selling pressures over the past week, lining us up for the rebound of prices that has now been realized.
This content is exclusive to subscribers of EquityClock.com. Please Log In or Subscribe to proceed.
Seasonal charts of companies reporting earnings today:
S&P 500 Index
TSE Composite
If you wish to be excluded from this distribution, simply reply to this email requesting to have your email removed from our list or click on the following link: **Note: You will continue to have access to our reports so long as your subscription at Equity Clock remains active. To manage your subscription to our service, please visit the Members Section at https://charts.equityclock.com/members.