You're receiving this daily market outlook because you are subscribed to Equity Clock. Want to opt-out and only receive the monthly and intraday reports? Simply reply to this email to let us know.
Having trouble viewing this email? View in your browser.
Equity Clock - Market Outlook for November 8, 2023
The price of oil is presently within its weakest time of year, but the pullback that is being realized provides the opportunity to buy into weakness.
*** Stocks highlighted are for information purposes only and should not be considered as advice to purchase or to sell mentioned securities. As always, the use of technical and fundamental analysis is encouraged in order to fine tune entry and exit points to average seasonal trends.
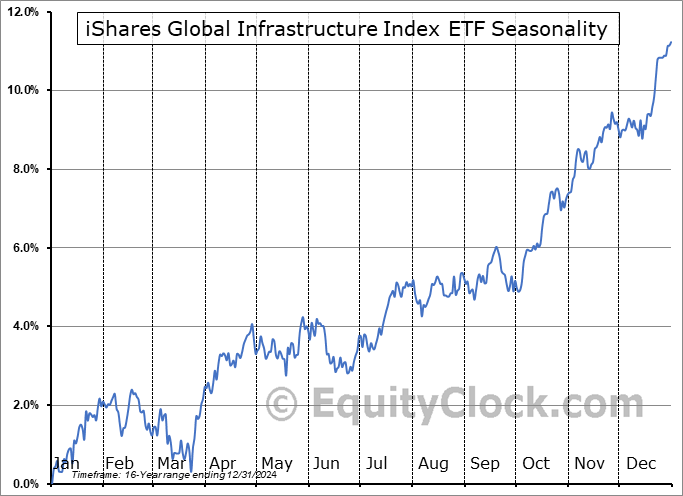
Stocks Entering Period of Seasonal Strength Today:
Subscribers Click on the relevant link to view the full profile. Not a subscriber? Signup here.
This content is exclusive to subscribers of EquityClock.com. Please Log In or Subscribe to proceed.
The Markets
Stocks closed generally mixed on Tuesday as core cyclical sectors came under pressure amidst weak data out of China. The S&P 500 Index added just less than three-tenths of one percent, pushing up towards horizontal resistance and the 100-day moving average at 4400. The benchmark remains in the midst of this cloud of moving averages and a convergence within has been materializing, underlining our concerns pertaining to the sustainability of the strength in stocks through the months ahead. The horizontal band of support between 4100 and 4200 remains vitally important to the intermediate-term trend, without it a move back to the band of support that the benchmark rebounded from in the spring between 3600 and 3800 may be in the cards. Both MACD and RSI have broken their declining trends that had been in place since July, providing hope for the same outcome for price as the markets gets further into this normal year-end rally period through November and December. Seasonally, beyond the start of November thrust higher in stock prices, a digestion of the gains is normal through the middle of the month until the period surrounding the US Thanksgiving holiday.
This content is exclusive to subscribers of EquityClock.com. Please Log In or Subscribe to proceed.
Seasonal charts of companies reporting earnings today:
S&P 500 Index
TSE Composite
If you wish to be excluded from this distribution, simply reply to this email requesting to have your email removed from our list or click on the following link: **Note: You will continue to have access to our reports so long as your subscription at Equity Clock remains active. To manage your subscription to our service, please visit the Members Section at https://charts.equityclock.com/members.


 Seasonal Chart")


 Seasonal Chart")


