You're receiving this daily market outlook because you are subscribed to Equity Clock. Want to opt-out and only receive the monthly and intraday reports? Simply reply to this email to let us know.
Having trouble viewing this email? View in your browser.
Equity Clock - Market Outlook for February 20, 2024
Housing starts just showed the weakest January change since 2009, at the height of the Great Financial Crisis.
*** Stocks highlighted are for information purposes only and should not be considered as advice to purchase or to sell mentioned securities. As always, the use of technical and fundamental analysis is encouraged in order to fine tune entry and exit points to average seasonal trends.
Stocks Entering Period of Seasonal Strength Today:
Subscribers Click on the relevant link to view the full profile. Not a subscriber? Signup here.
This content is exclusive to subscribers of EquityClock.com. Please Log In or Subscribe to proceed.
Note: Monday is a market holiday in both Canada and the US. Our next report will be released on Tuesday. Enjoy the long weekend!
The Markets
Stocks closed lower on Friday after another report of inflation in the economy stoked fears that conditions may not be present for the Fed to start cutting rates according to the market’s expectations. The S&P 500 Index closed down by half of one percent, pulling back from the intraday all-time high level charted in the past week at 5048.Gradually, we are seeing evidence of an equity market that is losing upside traction as momentum indicators (MACD and RSI) negatively diverge from price, a sign that buying demand is not as robust as it once was now that the market has reached record heights. Short-term support remains firmly ingrained around the 20-day moving average at 4942, a hurdle that is likely to be put to the test amidst the period of seasonal weakness for the market through the back half of February. While the previous all-time high of 4800 is the logical retracement point to a near-term market pullback, levels all the way down to previous horizontal resistance at 4600 are fair game as part of a healthy digestion of the strength that has been achieved in recent months.
This content is exclusive to subscribers of EquityClock.com. Please Log In or Subscribe to proceed.
Seasonal charts of companies reporting earnings today:
S&P 500 Index
TSE Composite
If you wish to be excluded from this distribution, simply reply to this email requesting to have your email removed from our list or click on the following link: **Note: You will continue to have access to our reports so long as your subscription at Equity Clock remains active. To manage your subscription to our service, please visit the Members Section at https://charts.equityclock.com/members.


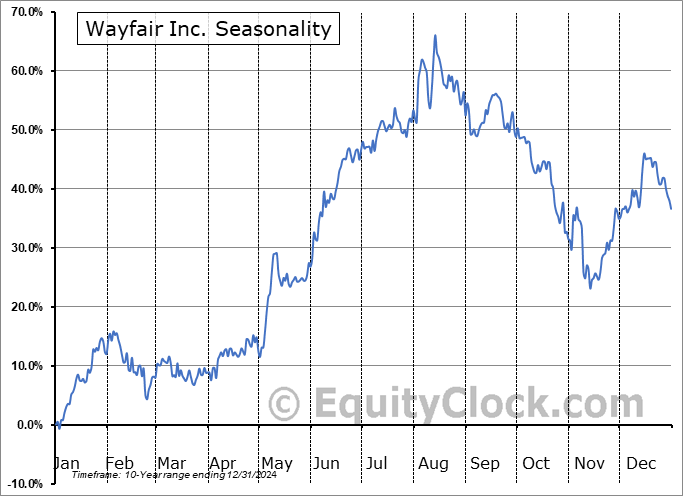
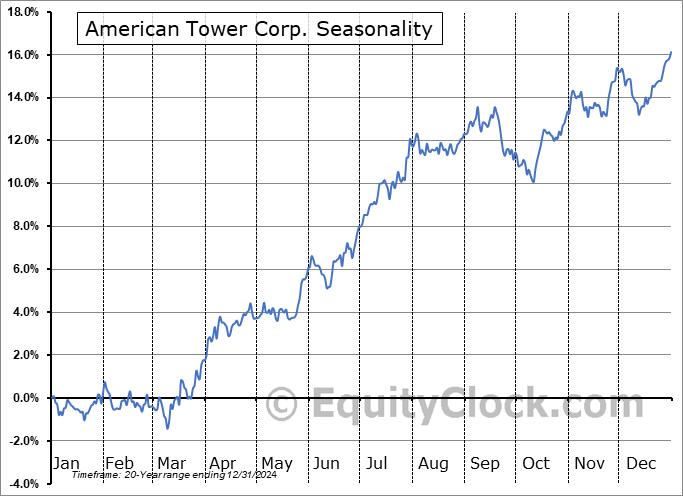


 Seasonal Chart")


