You're receiving this newsletter because you are subscribed to Equity Clock.
Having trouble viewing this email? View in your browser.
Equity Clock - Market Outlook for September 5, 2024
The yield curve is normalizing with the 10-year treasury yield moving back above the 2-year, typically a coincident indication of the start of an economic recession and corresponding downfall of stocks.
*** Stocks highlighted are for information purposes only and should not be considered as advice to purchase or to sell mentioned securities. As always, the use of technical and fundamental analysis is encouraged in order to fine tune entry and exit points to average seasonal trends.
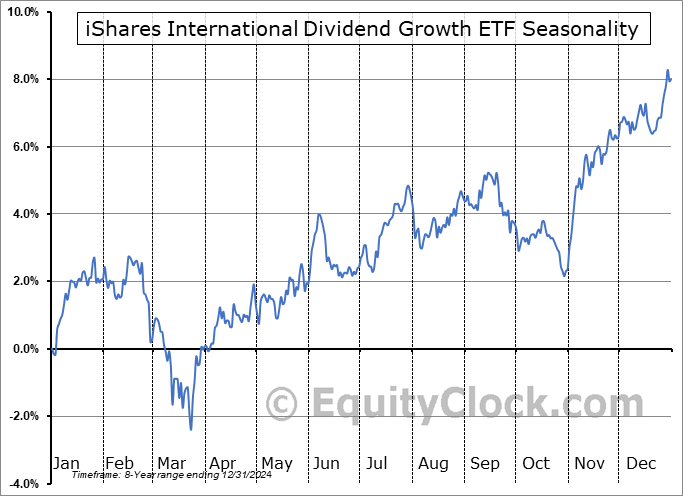
Stocks Entering Period of Seasonal Strength Today:
Subscribers Click on the relevant link to view the full profile. Not a subscriber? Signup here.
This content is exclusive to subscribers of EquityClock.com. Please Log In or Subscribe to proceed.
The Markets
Stocks struggled to get off the floor for a second day as investors reacted to weaker than expected read of job openings for the month of July. The S&P 500 Index closed with a loss of almost two-tenths of one percent, continuingto roll over from implied resistance between 5622 and 5658, representing the July 17th downside gap.A short-term peak has become confirmed as the bulls show their reluctance adding to risk at current heights and now we have to scrutinize the risk that theintermediate-term double-top pattern is showing. The chart setup sets the stage for the declines that are normal for stocks during the month of September, a framework that would be confirmed by a breakdown back below support at 20 and 50-week moving averages around 5500. MACD has crossed back below its signal line, confirming the negative divergence versus price that has highlighted the waning of buying demand heading into the traditionally weak month for equity market performance in September. Caution in risk assets remains appropriate, particularly while within this period of seasonal volatility and while the fundamental backdrop appears uncertain.
This content is exclusive to subscribers of EquityClock.com. Please Log In or Subscribe to proceed.
Seasonal charts of companies reporting earnings today:
S&P 500 Index
TSE Composite
If you wish to be excluded from this distribution, simply reply to this email requesting to have your email removed from our list or click on the following link: **Note: You will continue to have access to our reports so long as your subscription at Equity Clock remains active. To manage your subscription to our service, visit the Members Section at https://charts.equityclock.com/members