The trend of hiring is showing the weakest performance in the history of the Job Openings and Labor Turnover (JOLT) survey.
*** Stocks highlighted are for information purposes only and should not be considered as advice to purchase or to sell mentioned securities. As always, the use of technical and fundamental analysis is encouraged in order to fine tune entry and exit points to average seasonal trends.
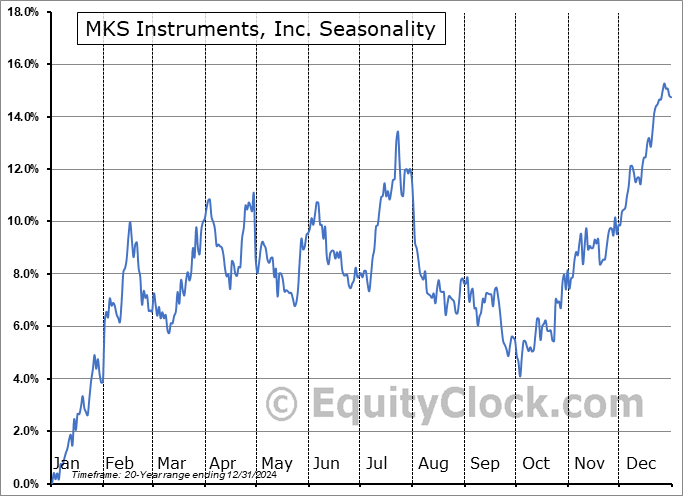
Stocks Entering Period of Seasonal Strength Today:
Subscribers Click on the relevant link to view the full profile. Not a subscriber? Signup here.


Super Simple Seasonal Portfolio
This content is exclusive to subscribers of EquityClock.com. Please Log In or Subscribe to proceed.
The Markets
Stocks slipped to start the first month of the last quarter as investors monitored the escalation of tensions between Iran and Israel. The S&P 500 Index closed with a loss of just over nine-tenths of one percent, pulling back from the record closing high level charted in the prior session. A rollover of the short-term trend is becoming apparent amidst the waning of near-term upside momentum; MACD can be seen converging back on its signal line and RSI is moving back towards its middle line, both giving up on their positive slopes that has been apparent over the past few weeks. A lack of excitement in stocks is apparent with the benchmark above former resistance at 5650. Fortunately, the levels of support below remain plentiful, including the aforementioned horizontal hurdle, as well as major moving averages that are all positively sloped as we head towards the best six month of the year timeframe that gets underway at month-end. Seasonality still gives an edge to a cautious view of stocks in the near-term, particularly given the evidence of near-term upside exhaustion, but a retracement lower would be viewed as an ideal reset before the normal end-of-year rally commences.

This content is exclusive to subscribers of EquityClock.com. Please Log In or Subscribe to proceed.
Seasonal charts of companies reporting earnings today:


S&P 500 Index


TSE Composite


