You're receiving this newsletter because you are subscribed to Equity Clock.
Having trouble viewing this email? View in your browser.


Equity Clock


Equity Clock - Market Outlook for November 18, 2024

Consumer activity perked up in October, but discretionary spending was not the focus.

*** Stocks highlighted are for information purposes only and should not be considered as advice to purchase or to sell mentioned securities. As always, the use of technical and fundamental analysis is encouraged in order to fine tune entry and exit points to average seasonal trends.

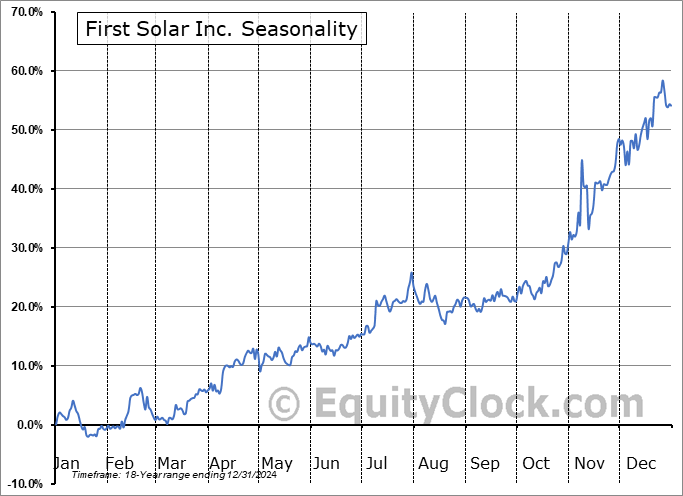
Stocks Entering Period of Seasonal Strength Today:

Subscribers Click on the relevant link to view the full profile. Not a subscriber? Signup here.

WisdomTree International Quality Dividend Growth Fund (AMEX:IQDG) Seasonal Chart

WisdomTree International Quality Dividend Growth Fund (AMEX:IQDG) Seasonal Chart

Snap Inc. (NYSE:SNAP) Seasonal Chart

Snap Inc. (NYSE:SNAP) Seasonal Chart

ECN Capital Corp. (TSE:ECN.TO) Seasonal Chart

ECN Capital Corp. (TSE:ECN.TO) Seasonal Chart

iShares MSCI Finland Capped ETF (AMEX:EFNL) Seasonal Chart

iShares MSCI Finland Capped ETF (AMEX:EFNL) Seasonal Chart

Global X SuperDividend ETF (AMEX:SDIV) Seasonal Chart

Global X SuperDividend ETF (AMEX:SDIV) Seasonal Chart

BMO Government Bond Index ETF (TSE:ZGB.TO) Seasonal Chart

BMO Government Bond Index ETF (TSE:ZGB.TO) Seasonal Chart

Vanguard Balanced ETF Portfolio (TSE:VBAL.TO) Seasonal Chart

Vanguard Balanced ETF Portfolio (TSE:VBAL.TO) Seasonal Chart

SeaWorld Entertainment, Inc. (NYSE:SEAS) Seasonal Chart

SeaWorld Entertainment, Inc. (NYSE:SEAS) Seasonal Chart

Nutrien Ltd. (TSE:NTR.TO) Seasonal Chart

Nutrien Ltd. (TSE:NTR.TO) Seasonal Chart

K-Bro Linen Inc. (TSE:KBL.TO) Seasonal Chart

K-Bro Linen Inc. (TSE:KBL.TO) Seasonal Chart

Northwest Healthcare Properties Real Estate Investment Trust (TSE:NWH/UN.TO) Seasonal Chart

Northwest Healthcare Properties Real Estate Investment Trust (TSE:NWH/UN.TO) Seasonal Chart

Interfor Corp. (TSE:IFP.TO) Seasonal Chart

Interfor Corp. (TSE:IFP.TO) Seasonal Chart

Superior Plus Corp. (TSE:SPB.TO) Seasonal Chart

Superior Plus Corp. (TSE:SPB.TO) Seasonal Chart

iShares Emerging Markets Local Currency Bond ETF (AMEX:LEMB) Seasonal Chart

iShares Emerging Markets Local Currency Bond ETF (AMEX:LEMB) Seasonal Chart

First Solar Inc. (NASD:FSLR) Seasonal Chart

First Solar Inc. (NASD:FSLR) Seasonal Chart

Radware Ltd. (NASD:RDWR) Seasonal Chart

Radware Ltd. (NASD:RDWR) Seasonal Chart

Taseko Mines Ltd. (TSE:TKO.TO) Seasonal Chart

Taseko Mines Ltd. (TSE:TKO.TO) Seasonal Chart

iShares Russell Mid-Cap Value ETF (NYSE:IWS) Seasonal Chart

iShares Russell Mid-Cap Value ETF (NYSE:IWS) Seasonal Chart

Portland General Electric Co. (NYSE:POR) Seasonal Chart

Portland General Electric Co. (NYSE:POR) Seasonal Chart

Interpublic Grp Of Cos (NYSE:IPG) Seasonal Chart

Interpublic Grp Of Cos (NYSE:IPG) Seasonal Chart

Barrick Gold Corp. (TSE:ABX.TO) Seasonal Chart

Barrick Gold Corp. (TSE:ABX.TO) Seasonal Chart

CGI Group, Inc. (TSE:GIB/A.TO) Seasonal Chart

CGI Group, Inc. (TSE:GIB/A.TO) Seasonal Chart

Smith and Nephew PLC (NYSE:SNN) Seasonal Chart

Smith and Nephew PLC (NYSE:SNN) Seasonal Chart

Cisco Systems, Inc. (NASD:CSCO) Seasonal Chart

Cisco Systems, Inc. (NASD:CSCO) Seasonal Chart


Super Simple Seasonal Portfolio


This content is exclusive to subscribers of EquityClock.com. Please Log In or Subscribe to proceed.


The Markets

Concerns over Donald Trump’s nominations for members of his cabinet took a toll on stocks on Friday, causing an alleviation of some of the post election rally in the market.  The S&P 500 Index closed down by 1.32%, moving down from the important psychological threshold and the year-end target of many analysts at 6000.  Support at the 20-day moving average is being tested (5860), along with gap support that was opened over a week ago between 5783 and 5864, a zone that was reasonable to be filled before the march higher aligned with seasonal norms continues around the US Thanksgiving holiday.  On a intermediate-term scale, there remains greater evidence of support than resistance, presenting characteristics of a bullish trend that remains enticing for the strength that is normally realized in the market at year-end.  MACD has curled higher above its middle line following the surge in prices in recent weeks, reconfirming characteristics of a bullish trend.  We continue to like how our list of candidates in the market to Accumulate and to Avoid is positioned, but we are cognizant of changing market dynamics as revelations pertaining to Trump’s initiatives become apparent and as dollar/rate headwinds grow.  We will be scrutinizing whether any changes are required in the days/weeks ahead as the price action evolves.


This content is exclusive to subscribers of EquityClock.com. Please Log In or Subscribe to proceed.


Seasonal charts of companies reporting earnings today:

AECOM Seasonal Chart Trip.com Group Limited Seasonal Chart Brady Seasonal Chart Twist Bioscience Seasonal Chart PPDAI Group Seasonal Chart i3 Verticals Seasonal Chart TAT Technologies Seasonal Chart Niu Technologies Seasonal Chart Cellectar Biosciences Seasonal Chart Zepp Health Seasonal Chart


S&P 500 Index


TSE Composite


If you wish to be excluded from this distribution, simply reply to this email requesting to have your email removed from our list or click on the following link: **Note: You will continue to have access to our reports so long as your subscription at Equity Clock remains active. To manage your subscription to our service, visit the Members Section at https://charts.equityclock.com/members

Copyright Equity Clock 2025