You're receiving this newsletter because you are subscribed to Equity Clock.
Having trouble viewing this email? View in your browser.
Equity Clock - Market Outlook for February 27, 2025
The downbeat economic performance to start the year continues, this time with shipping volumes and new home sales.
*** Stocks highlighted are for information purposes only and should not be considered as advice to purchase or to sell mentioned securities. As always, the use of technical and fundamental analysis is encouraged in order to fine tune entry and exit points to average seasonal trends.
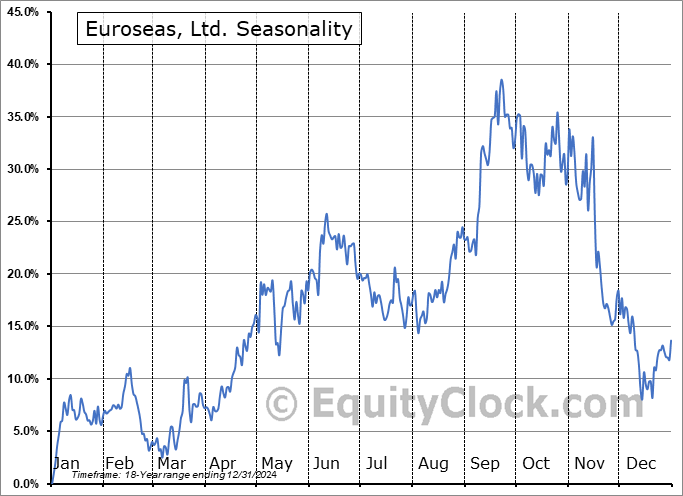
Stocks Entering Period of Seasonal Strength Today:
Subscribers Click on the relevant link to view the full profile. Not a subscriber? Signup here.
This content is exclusive to subscribers of EquityClock.com. Please Log In or Subscribe to proceed.
The Markets
The struggle in stocks continues to progress as per usual for the back half of February. The S&P 500 Index closed little changed during the Wednesday session, charting a rather incisive doji candlestick below former support and current resistance at the 50-day moving average (6004). A cap to the benchmark remains overhead around 6100, representing the highs from the past few months. Momentum indicators have negatively diverged from price since the middle of last year, highlighting the waning enthusiasm investors had been expressing towards tech-heavy (Mag-7) benchmarks, like this, amidst extreme valuations. Downside risks on a pullback over the near-term are to the July/August 2024 highs around 5700, a move that would amount to a 7% pullback from recent heights.This would be a healthy and ordinary correction within a bull market, by any measure. We continue to monitor the potential impact of the apparent rotation in the market on our list of candidates in the market to Accumulate and to Avoid and we have adopted more of a neutral stance as segments that were previously noted as Accumulate candidates fall off (eg. Technology) and as areas to Avoid are added.
This content is exclusive to subscribers of EquityClock.com. Please Log In or Subscribe to proceed.
Seasonal charts of companies reporting earnings today:
S&P 500 Index
TSE Composite
If you wish to be excluded from this distribution, simply reply to this email requesting to have your email removed from our list or click on the following link: **Note: You will continue to have access to our reports so long as your subscription at Equity Clock remains active. To manage your subscription to our service, visit the Members Section at https://charts.equityclock.com/members