Cryptocurrency market testing some critical levels that will put the bull market trend of the past couple of years to the test.
*** Stocks highlighted are for information purposes only and should not be considered as advice to purchase or to sell mentioned securities. As always, the use of technical and fundamental analysis is encouraged in order to fine tune entry and exit points to average seasonal trends.
Stocks Entering Period of Seasonal Strength Today:
Subscribers Click on the relevant link to view the full profile. Not a subscriber? Signup here.


Super Simple Seasonal Portfolio
This content is exclusive to subscribers of EquityClock.com. Please Log In or Subscribe to proceed.
The Markets
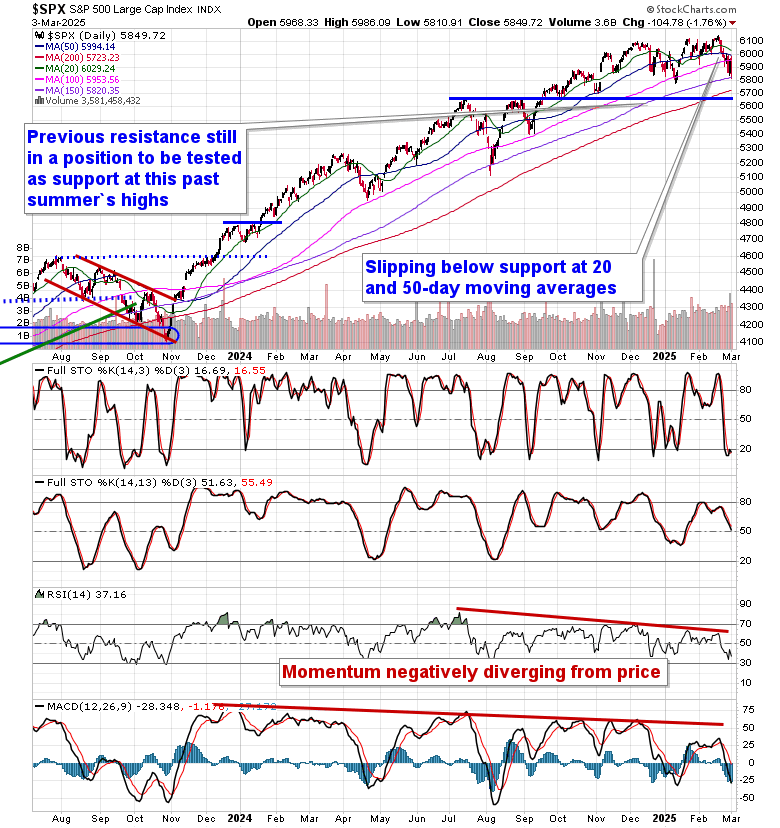
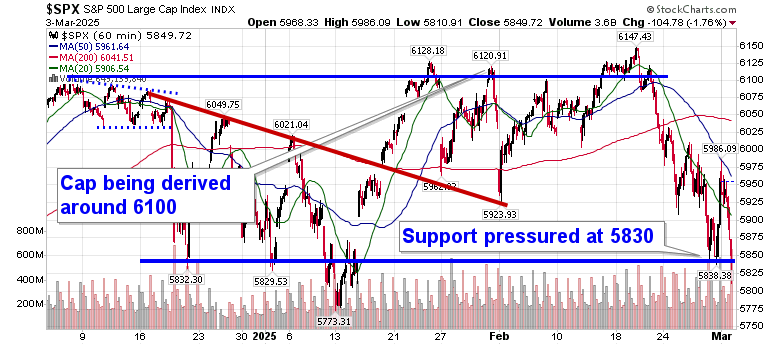
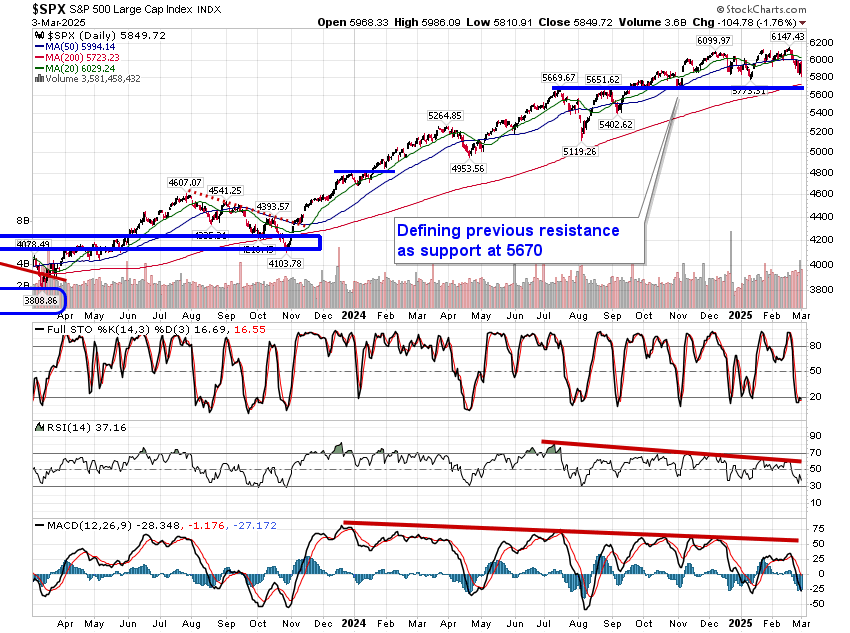
Tariff concerns continued to overhang markets on Monday, resulting in the largest single session decline for the S&P 500 Index since December. The large-cap benchmark fell by 1.76%, showing renewed rejection from resistance at the 50-day moving average (5994). The lower limit of the short-term trading range between 5830 and 6100 is being pressured, a break of which would see an easy runway back to highs charted last July and August around 5700. Momentum indicators on the daily chart have negatively diverged from price since the middle of last year, highlighting the waning enthusiasm investors had been expressing towards tech-heavy (Mag-7) benchmarks, like this, amidst extreme valuations. For now, the drawdown in the market can still be viewed as healthy and ordinary within a bull market, by any measure, but some critical levels below will warrant scrutiny, such as 5700 on the S&P 500 and 73,000 for Bitcoin. Below these thresholds, more dire scenarios for risk assets must be considered. We continue to monitor the potential impact of the apparent rotation in the market on our list of candidates in the market to Accumulate and to Avoid and we have adopted more of a neutral stance as segments that were previously noted as Accumulate candidates fall off (eg. Technology) and as areas to Avoid are added.
This content is exclusive to subscribers of EquityClock.com. Please Log In or Subscribe to proceed.
Seasonal charts of companies reporting earnings today:


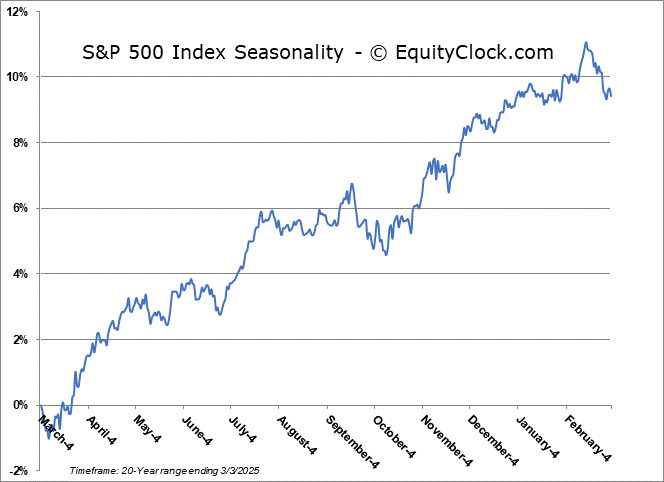
S&P 500 Index
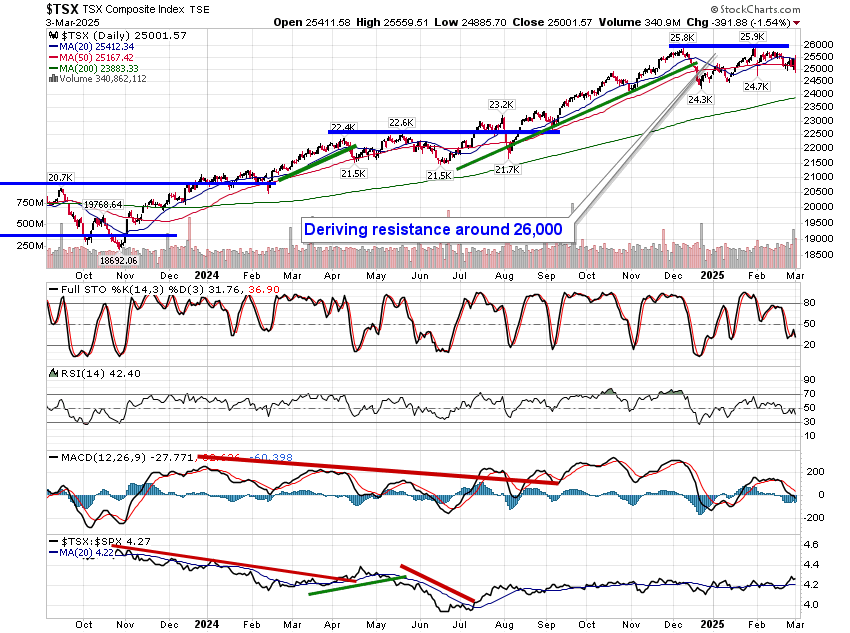
TSE Composite