You're receiving this newsletter because you are subscribed to Equity Clock.
Having trouble viewing this email? View in your browser.
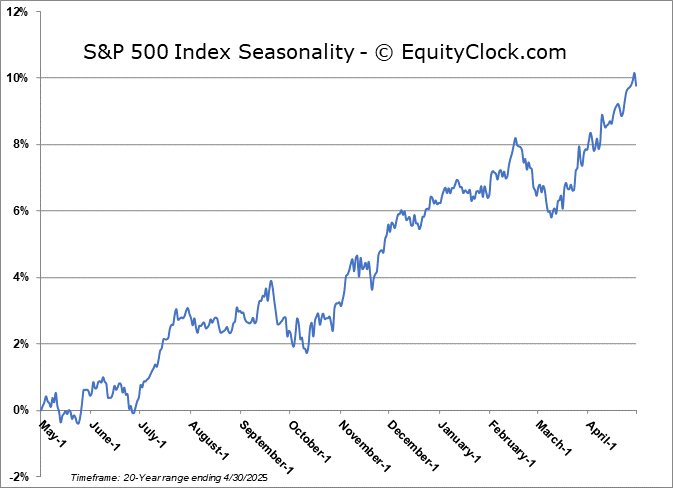
Equity Clock - Market Outlook for May 1, 2025
While the start of the off-season for stocks gets underway in May, the S&P 500 Index has still averaged a gain of 0.8% during this fifth month of the year over the past five decades.
*** Stocks highlighted are for information purposes only and should not be considered as advice to purchase or to sell mentioned securities. As always, the use of technical and fundamental analysis is encouraged in order to fine tune entry and exit points to average seasonal trends.
Stocks Entering Period of Seasonal Strength Today:
Subscribers Click on the relevant link to view the full profile. Not a subscriber? Signup here.
This content is exclusive to subscribers of EquityClock.com. Please Log In or Subscribe to proceed.
The Markets
Stocks shook off earlier losses attributed to a weak read of US GDP on Wednesday to close fairly mixed in the final trading session of April. The S&P 500 Index added just over a tenth of one percent, continuing to progress above the declining 20-day moving average (5356) and staying afloat above resistance at 5500. There remains an implied cap over this market in the range between 5500 and 5800 that would likely require a catalyst to break (eg. progress towards a trade deal with China); without one, look for the sellers to step in around this zone. Initial reaction to resistance around the declining 50-day moving average (5602) was picked up early on Wednesday, causing an intraday move below the lows of the prior session and suggesting some hesitation among investors around this zone.The daily MACD histogram has started to stall and buying demand from this bear-market rally can be suggested to be waning. This is enticing us to start legging out of equity allocations heading into the offseason for stocks that begins in May as we brace for the next evolution of the intermediate-term trend in the equity market that is leaning negative. We continue to monitor the potential impact of the rotation in the market on our list of candidates in the market to Accumulate and to Avoid, but we have found rotation/buying candidates in recent weeks amidst this market tumult.
This content is exclusive to subscribers of EquityClock.com. Please Log In or Subscribe to proceed.
Seasonal charts of companies reporting earnings today:
S&P 500 Index
TSE Composite
If you wish to be excluded from this distribution, simply reply to this email requesting to have your email removed from our list or click on the following link: **Note: You will continue to have access to our reports so long as your subscription at Equity Clock remains active. To manage your subscription to our service, visit the Members Section at https://charts.equityclock.com/members