Over the past five decades, the S&P 500 Index has averaged a return of 0.6% June with a gain frequency of 64%.
*** Stocks highlighted are for information purposes only and should not be considered as advice to purchase or to sell mentioned securities. As always, the use of technical and fundamental analysis is encouraged in order to fine tune entry and exit points to average seasonal trends.
Stocks Entering Period of Seasonal Strength Today:
Subscribers Click on the relevant link to view the full profile. Not a subscriber? Signup here.


Super Simple Seasonal Portfolio
This content is exclusive to subscribers of EquityClock.com. Please Log In or Subscribe to proceed.
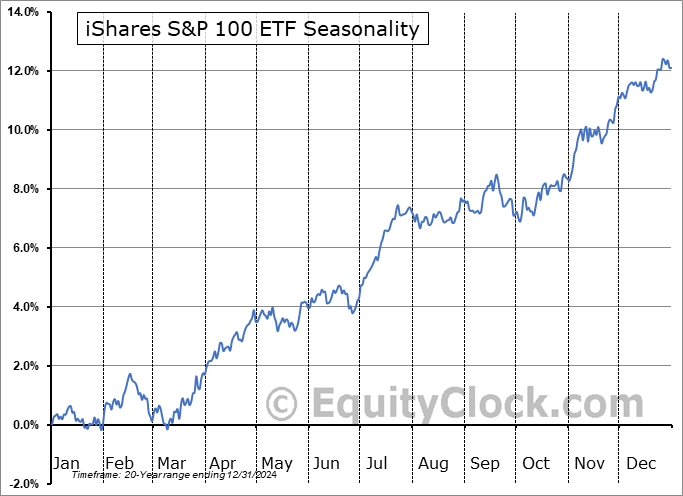
The Markets
Stocks closed fairly flat in the last trading session of May as investors monitored the developments pertaining to trade and ongoing tariff uncertainty. The S&P 500 Index slipped by a mere basis point (0.01%), continuing to test the band of resistance between 5900 and 6100. The moves over the past couple of days, albeit slight, are providing hint that the short-term rising trend stemming from the April lows is coming to an end with the 50-hour moving average no longer enticing the type of buying demand that has been observed over the past month and a half; a digestive period heading into the end of the second quarter is likely underway. Upside gap support around 5700 remains the critical level to watch over the short-term timeframe given a violation of the implied level of support would lead to a resumption of the strains that the intermediate-term trend has been portraying since the start of the year. Our list of candidates in the market that are worthy to Accumulate continue to perform well and we have significantly added to our list of Avoid candidates in the past week heading towards the seasonally weak period in June.


This content is exclusive to subscribers of EquityClock.com. Please Log In or Subscribe to proceed.
Seasonal charts of companies reporting earnings today:


S&P 500 Index


TSE Composite


