Stocks: Sectors
- Energy
- Materials
- Industrials
- Consumer Discretionary
- Consumer Staples
- Health Care
- Financial
- Technology
- Utilities
Futures
Benchmarks
Forex
Industries
Comparative
Seasonal Start
Economic Data
Ball Corp. (NYSE:BALL) Seasonal Chart
Seasonal Chart Analysis
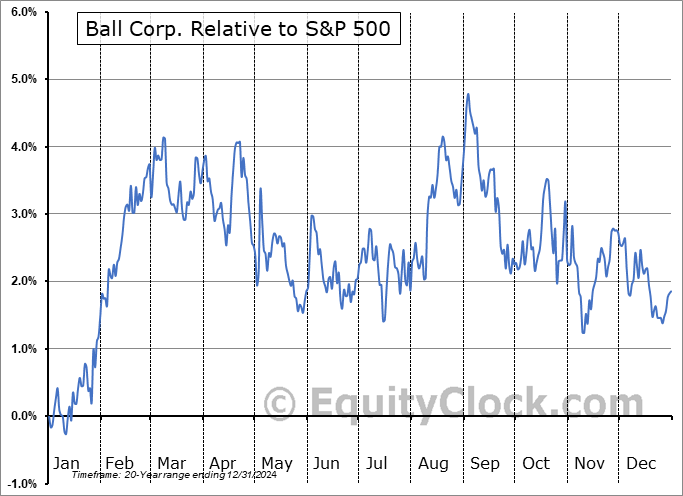
Analysis of the Ball Corp. (NYSE:BALL) seasonal charts above shows that a Buy Date of January 11 and a Sell Date of April 24 has resulted in a geometric average return of 3.68% above the benchmark rate of the S&P 500 Total Return Index over the past 20 years. This seasonal timeframe has shown positive results compared to the benchmark in 16 of those periods. This is a very good rate of success and the return strongly outperforms the relative buy-and-hold performance of the stock over the past 20 years by an average of 4.83% per year.
The seasonal timeframe is Inline with the period of seasonal strength for the Materials sector, which runs from November 20 to May 5. The seasonal chart for the broad sector is available via the following link: Materials Sector Seasonal Chart.
Ball Corp. engages in the supplies of aluminum packaging for the beverage, personal care, and household products industries. It operates through the following segments: Beverage Packaging North and Central America, Beverage Packaging South America, and Beverage Packaging Europe, Middle East and Africa (EMEA). The Beverage Packaging North and Central America segment includes multi-year supply contracts to fillers of carbonated soft drinks, beer, energy drinks, and other beverages. The Beverage Packaging South America segment includes beverage containers in South America, and the manufacture of substantially all the metal beverage containers in Brazil. The Beverage Packaging EMEA segment consists of metal beverage containers in Europe, and other packaging materials used by the European beer and carbonated soft drink industries. The company was founded by Edmund Burke Ball, Frank Clayton Ball, George A. Ball, Lucius Lorenzo Ball, and William Charles Ball in 1880 and is headquartered in Westminster, CO.
 To download BALL seasonal chart data, please log in or Subscribe.
Stocks mentioned in this post: BALL
Symbols by Letter: A | B | C | D | E | F | G | H | I | J | K | L | M | N | O | P | Q | R | S | T | U | V | W | X | Y | Z
|
|


