Help | RSS Feed

    Search Seasonal Charts by Symbol, Company, or Term

   Symbols by Letter: A | B | C | D | E | F | G | H | I | J | K | L | M | N | O | P | Q | R | S | T | U | V | W | X | Y | Z


Energy Sector Seasonal Chart

Energy Sector Seasonality

The period of seasonal strength for the Energy Sector ranges from January 21st through to May 9th. Seasonal influences are related to the refiner transition period when they convert their facilities to gasoline production for the summer driving season. Inventory levels typically fall below average during this period.


Charts Listed Under Energy

Genie Energy Ltd. (NYSE:GNE) Seasonal Chart

Genie Energy Ltd. (NYSE:GNE) Seasonal Chart

For full access, please log in or Subscribe.

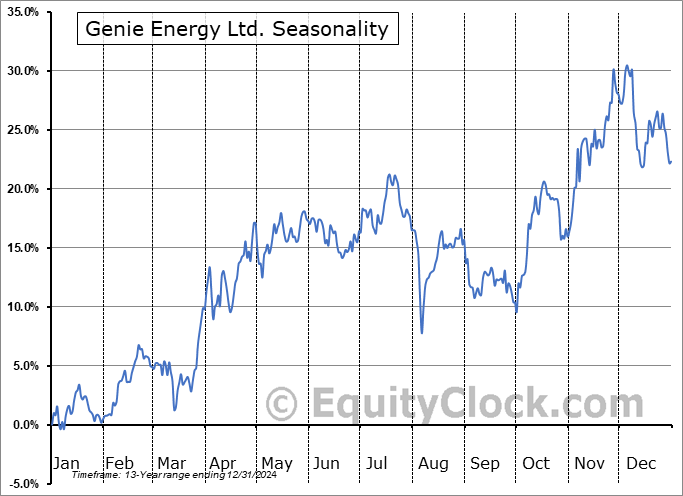
Seasonal Start: January 8 | Energy, G |

Blue Dolphin Energy Co. (OTCMKT:BDCO) Seasonal Chart

Blue Dolphin Energy Co. (OTCMKT:BDCO) Seasonal Chart

For full access, please log in or Subscribe.

Seasonal Start: January 4 | B, Energy |

New Zealand Energy Corp. (TSXV:NZ.V) Seasonal Chart

New Zealand Energy Corp. (TSXV:NZ.V) Seasonal Chart

For full access, please log in or Subscribe.

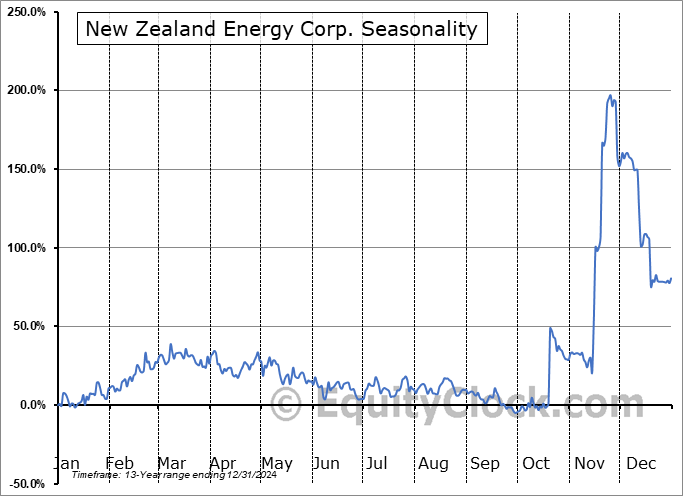
Seasonal Start: January 3 | Energy, N |

Ferrellgas Partners L.P (OTCMKT:FGPR) Seasonal Chart

Ferrellgas Partners L.P (OTCMKT:FGPR) Seasonal Chart

For full access, please log in or Subscribe.

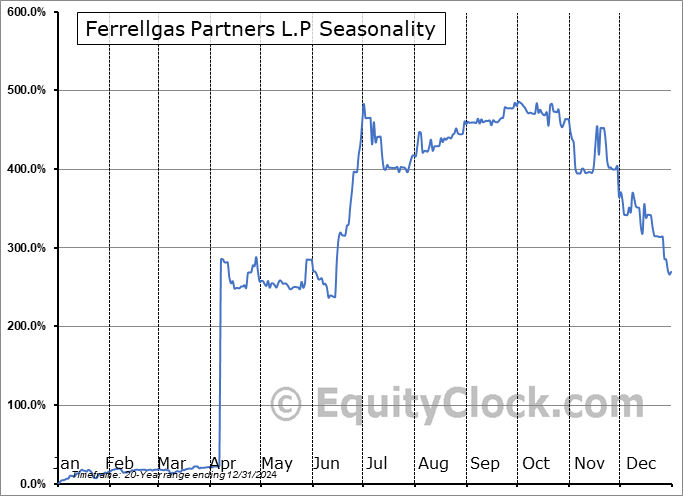
Seasonal Start: January 1 | Energy, F |

United American Petroleum Corp. (OTCMKT:UAPC) Seasonal Chart

United American Petroleum Corp. (OTCMKT:UAPC) Seasonal Chart

For full access, please log in or Subscribe.

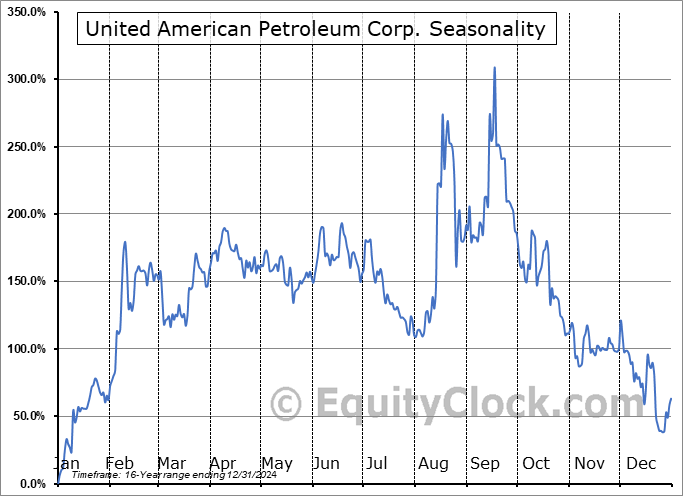
Seasonal Start: January 1 | Energy, U |


Sponsored By...
Seasonal Advantage Portfolio by CastleMoore