
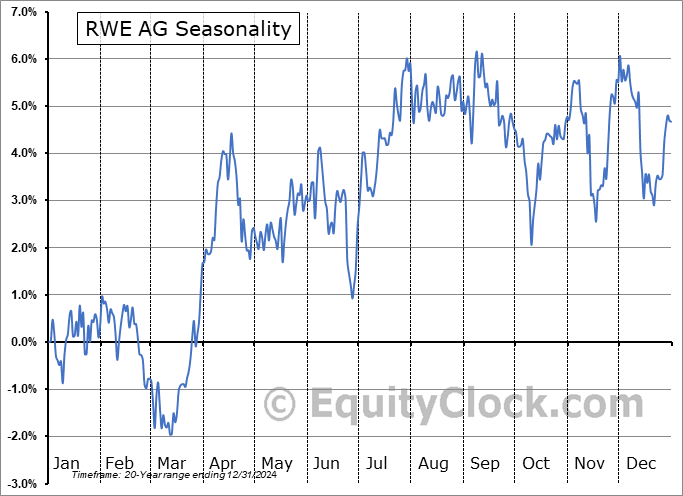
The period of seasonal strength for the Utilities Sector ranges from July 23rd through to October 3rd. Strength in the sector is related to decling borrowing costs during the summer months, as well as increased consumption of water and electrical utilities that follows the hotter weather.

For full access, please
log in or
Subscribe.
Seasonal Start: January 23 | C, Utilities | Stocks

For full access, please
log in or
Subscribe.
Seasonal Start: January 23 | C, Utilities | Stocks
For full access, please
log in or
Subscribe.
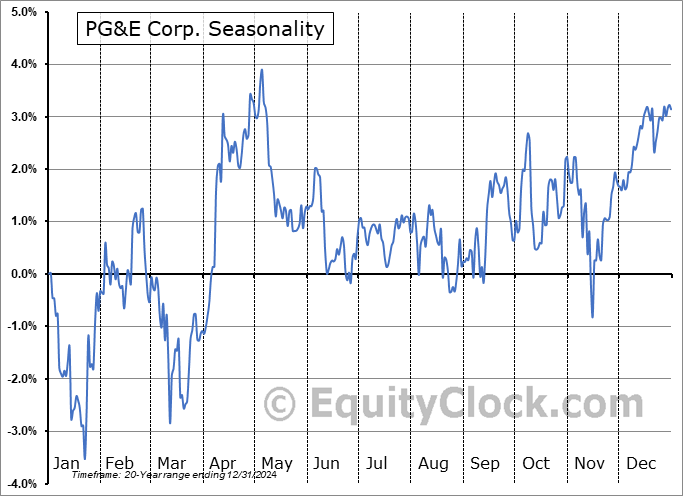
Seasonal Start: January 21 | P, Utilities | Stocks
For full access, please
log in or
Subscribe.
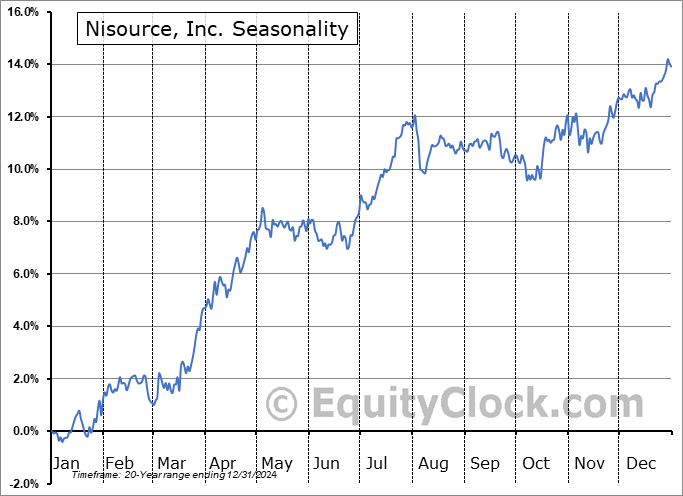
Seasonal Start: January 13 | N, Utilities | Stocks

For full access, please
log in or
Subscribe.
Seasonal Start: January 12 | P, Utilities | Stocks

For full access, please
log in or
Subscribe.
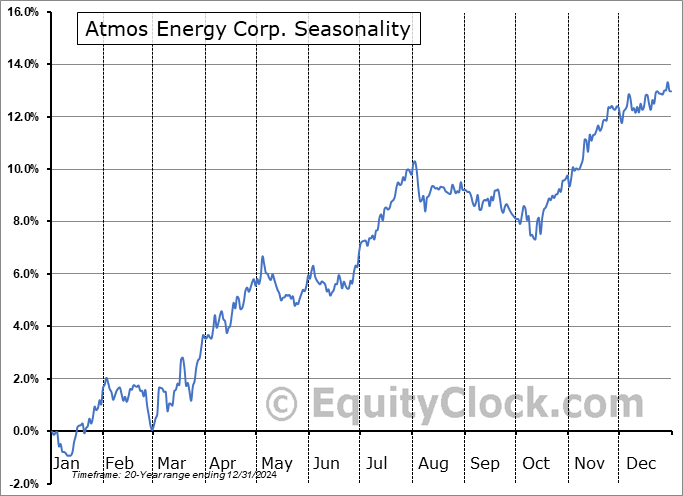
Seasonal Start: January 12 | O, Utilities | Stocks

For full access, please
log in or
Subscribe.
Seasonal Start: January 11 | S, Utilities | Stocks
For full access, please
log in or
Subscribe.
Seasonal Start: January 11 | A, Utilities | Stocks
For full access, please
log in or
Subscribe.
Seasonal Start: January 10 | R, Utilities | Stocks

For full access, please
log in or
Subscribe.
Seasonal Start: January 9 | S, Utilities | Stocks

