Stocks: Sectors
- Energy
- Materials
- Industrials
- Consumer Discretionary
- Consumer Staples
- Health Care
- Financial
- Technology
- Utilities
Futures
Benchmarks
Forex
Industries
Comparative
Seasonal Start
Economic Data
NetEase.com, Inc. (NASD:NTES) Seasonal Chart
Seasonal Chart Analysis
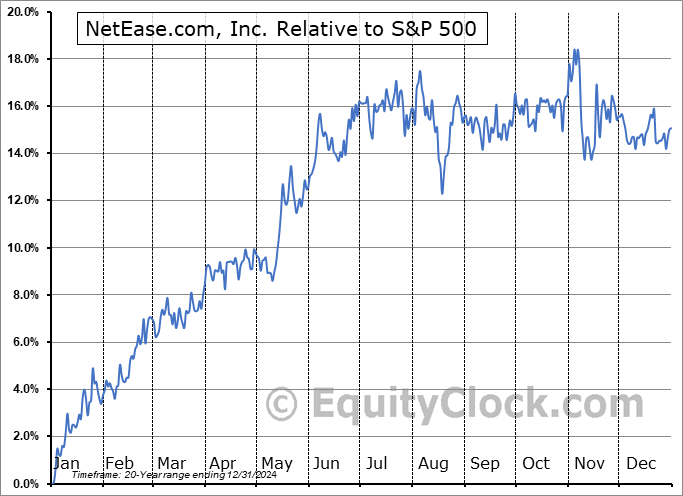
Analysis of the NetEase.com, Inc. (NASD:NTES) seasonal charts above shows that a Buy Date of October 28 and a Sell Date of February 26 has resulted in a geometric average return of 6.24% above the benchmark rate of the S&P 500 Total Return Index over the past 20 years. This seasonal timeframe has shown positive results compared to the benchmark in 17 of those periods. This is a very good rate of success, but the return underperforms the relative buy-and-hold performance of the stock over the past 20 years by an average of 4.41% per year.
The seasonal timeframe is Inline with the period of seasonal strength for the Industrials sector, which runs from October 29 to May 10. The seasonal chart for the broad sector is available via the following link: Industrials Sector Seasonal Chart.
NetEase, Inc. is an internet technology company, which engages in the provision of premium online services centered around content, community, communication and commerce. It develops and operates some of the most popular PC-client and mobile games in China. The firm also operates some of the most popular international online games in China by partnering with Blizzard Entertainment, Mojang AB (a Microsoft subsidiary) and other global game developers. NetEase also offers other services, including the intelligent learning services of its majority-controlled subsidiary, Youdao, its music streaming platform, NetEase Cloud Music, and its private label e-commerce platform, Yanxuan. The company operates through the following business segments: Online Game Services, Youdao, Cloud Music, and Innovative Businesses and Others. The Online Game Services segment produces online PC-client games. The Youdao segment is an online education service provider in China. The Cloud Music segment represents revenue from online music services through the sales of membership subscriptions in various content and service packages. The Innovative Businesses and Others segment offers other services, which includes live video streaming and its private label e-commerce platform, Yanxuan. The company was founded by Lei Ding in June 1997 and is headquartered in Beijing, China.
 To download NTES seasonal chart data, please log in or Subscribe.
Stocks mentioned in this post: NTES
Symbols by Letter: A | B | C | D | E | F | G | H | I | J | K | L | M | N | O | P | Q | R | S | T | U | V | W | X | Y | Z
|
|


