Stocks: Sectors
- Energy
- Materials
- Industrials
- Consumer Discretionary
- Consumer Staples
- Health Care
- Financial
- Technology
- Utilities
Futures
Benchmarks
Forex
Industries
Comparative
Seasonal Start
Economic Data
Regis Corp. (NASD:RGS) Seasonal Chart
Seasonal Chart Analysis
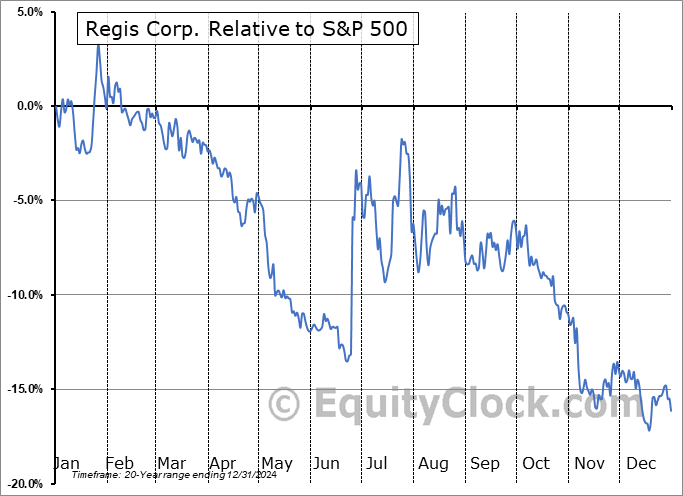
Analysis of the Regis Corp. (NASD:RGS) seasonal charts above shows that a Buy Date of June 21 and a Sell Date of September 9 has resulted in a geometric average return of 5.02% above the benchmark rate of the S&P 500 Total Return Index over the past 20 years. This seasonal timeframe has shown positive results compared to the benchmark in 11 of those periods. This is a fair rate of success and the return strongly outperforms the relative buy-and-hold performance of the stock over the past 20 years by an average of 28.29% per year.
The seasonal timeframe correlates Poorly with the period of seasonal strength for the Consumer Discretionary sector, which runs from October 17 to April 12. The seasonal chart for the broad sector is available via the following link: Consumer Discretionary Sector Seasonal Chart.
Regis Corp. engages in the provision of ownership, franchise, and operation of beauty salons. It operates through the Company-Owned Salons and Franchise Salons segments. It also sells hair care and other beauty products. Its brands include Supercuts, SmartStyle Hair Salon, Cost Cutters, First Choice Haircutters, Roosters, Opensalon, and Best Cuts. The company was founded by Paul Kunin and Florence Kunin in 1922 and is headquartered in Minneapolis, MN.
 To download RGS seasonal chart data, please log in or Subscribe.
Stocks mentioned in this post: RGS
Symbols by Letter: A | B | C | D | E | F | G | H | I | J | K | L | M | N | O | P | Q | R | S | T | U | V | W | X | Y | Z
|
|


