Stocks: Sectors
- Energy
- Materials
- Industrials
- Consumer Discretionary
- Consumer Staples
- Health Care
- Financial
- Technology
- Utilities
Futures
Benchmarks
Forex
Industries
Comparative
Seasonal Start
Economic Data
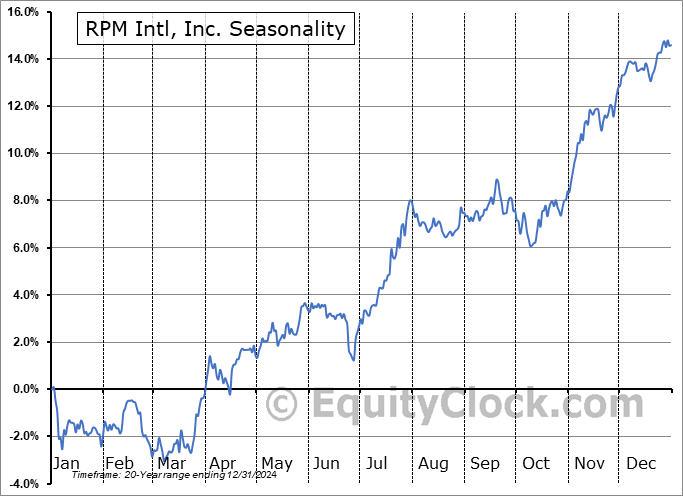
RPM Intl, Inc. (NYSE:RPM) Seasonal Chart
Seasonal Chart Analysis
Analysis of the RPM Intl, Inc. (NYSE:RPM) seasonal charts above shows that a Buy Date of June 24 and a Sell Date of September 21 has resulted in a geometric average return of 2.63% above the benchmark rate of the S&P 500 Total Return Index over the past 20 years. This seasonal timeframe has shown positive results compared to the benchmark in 16 of those periods. This is a very good rate of success and the return outperforms the relative buy-and-hold performance of the stock over the past 20 years by an average of 1.36% per year.
The seasonal timeframe correlates Poorly with the period of seasonal strength for the Materials sector, which runs from November 20 to May 5. The seasonal chart for the broad sector is available via the following link: Materials Sector Seasonal Chart.
RPM International, Inc. engages in the manufacture, marketing, and sale of coatings, sealants, building materials, and related services. It operates through the following segments: Construction Products Group (CPG), Performance Coatings Group (PCG), Consumer Group, and Specialty Products Group (SPG). The CPG segment refers to construction sealants and adhesives, coatings and chemicals, roofing systems, concrete admixture and repair products, building envelope solutions, insulated cladding, flooring systems, and weatherproofing solutions. The PCG segment focuses on flooring solutions, corrosion control and fireproofing coatings, infrastructure repair systems, fiberglass reinforced plastic gratings and drainage systems. The Consumer Group segment includes rust-preventative, special purpose, and decorative paints, caulks, sealants, primers, cement cleaners, floor sealers and woodcare coatings, sandpaper and other abrasives, and other branded consumer products. The SPG segment relates to industrial cleaners, restoration services equipment, colorants, nail enamels, exterior finishes, edible coatings and specialty glazes for pharmaceutical and food industries, and other specialty original equipment manufacturer coatings. The company was founded by Frank C. Sullivan in May 1947 and is headquartered in Medina, OH.
 To download RPM seasonal chart data, please log in or Subscribe.
Stocks mentioned in this post: RPM
Symbols by Letter: A | B | C | D | E | F | G | H | I | J | K | L | M | N | O | P | Q | R | S | T | U | V | W | X | Y | Z
|
|


